Last post I mentioned an intersection in New York City that averaged two crashes a week over the 14 years of crash data. That was technically accurate, but misleading. The rate was substantially higher in the pre-Covid days, and much lower since. That’s because crash rates in New York City have plummeted since 2020:
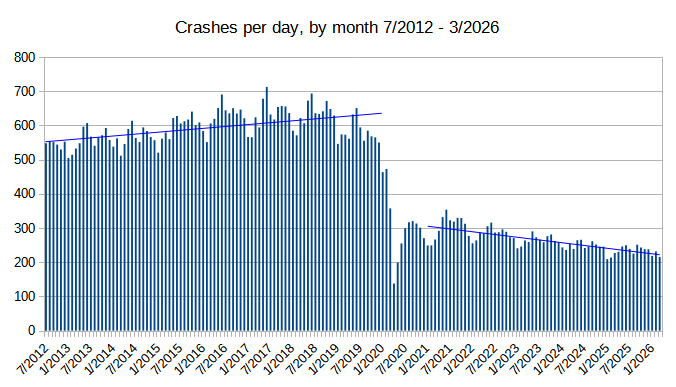
Obviously the massive drop off in 2020 was caused by the COVID shutdown. But as businesses started reopening in 2021 the crash rate came back up, just nowhere near the previous totals. It appears that traffic patterns in New York have changed, perhaps permanently.
Also, note the trend bars. Over the 7+ years before COVID, crash rates were steadily increasing. But since the return to the “new normal” in 2021, the trend is downward. New York traffic officials claim that their Vision Zero efforts are paying off, and they may be correct.
Disturbingly, the graph of injuries isn’t as dramatic:
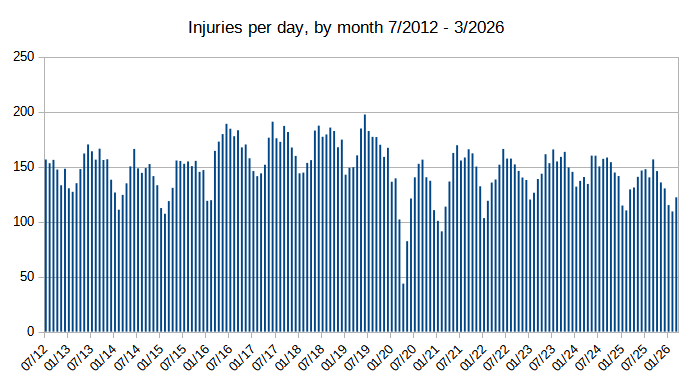
Once again there’s a sudden dropoff when COVID started. And the rate never returns to its pre-shutdown levels. But unlike the crash rate, which is less than half of what it used to be, the injury rate is only 20% lower. Which means there are a lot fewer crashes, but they seem to be more severe:
| Injuries per Crash | |
| Pre-COVID (thru 2019) | 0.26 |
| Post-COVID (2021 and later) | 0.54 |
Remarkably, the injury rate per crash is double what it was before! How is this possible? Here are some candidate explanations:
- After the pandemic, people have transitioned to walking and biking more frequently. Pedestrians and cyclers are more likely to be injured in a crash, so more pedestrians and cyclers on the roads means a higher injury rate.
- Post-pandemic driving has changed the mix of crash types; aggressive behavior is leading to more injuries.
- Reporting issues. Police are less likely to report minor fender-benders.
Let’s look at each of these.
More walker and bikers. If this was the case, we would expect the percentage of injuries to bike riders and pedestrians to be higher post-COVID. But I don’t see it:
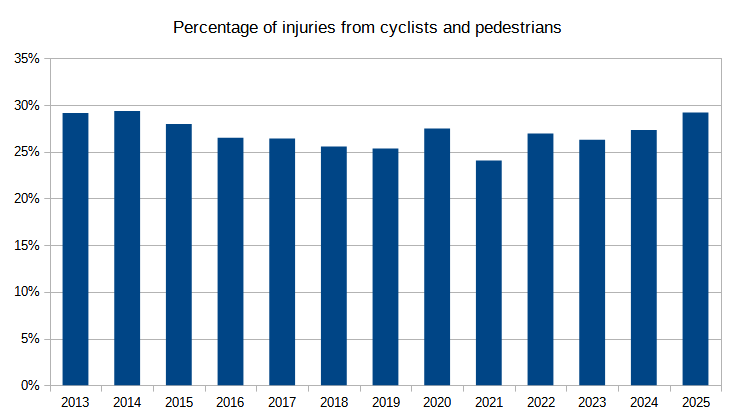
Looks pretty flat. There’s a small jump in the past couple of years, but not enough to explain the doubling of the injury rate.
Post-pandemic driving is more aggressive. We’ve seen frequent articles and reports about the increase of aggressive and risky driving behavior since 2020. Could that explain why the injury rate is up? Let’s take a look. Pre-COVID, the five riskiest causes were:
| Cause | Injuries per crash (pre-COVID) | Pre-COVID frequency | Post-COVID frequency |
| Unsafe Speed | 0.64 | 1.4% | 5.0% |
| Traffic Control Disregarded | 0.63 | 2.6% | 3.3% |
| Alcohol Involvement | 0.47 | 1.4% | 2.2% |
| Failed to Yield Right-of-Way | 0.41 | 9.0% | 9.0% |
| Aggressive Driving/Road Rage | 0.39 | 0.6% | 1.1% |
Note the final column – the incidence of crashes caused by speeding, running red lights, drunk driving, and road rage all increased post-pandemic; speeding by a remarkable 250%. It’s clear that this increase in dangerous driving behavior is real. But when I crunch the numbers further, it turns out this explains only about 15-20% of the increase in the injury rate. If the frequency of this risky driving still occurred at pre-COVID rates, the Injuries/Crash ratio would drop from 0.54 to 0.48. Still well above the 0.26 rate from before COVID. So bad behavior explains a small part of the increase, but not the majority.
Reporting issues. That leaves reporting issues, and I suspect this explains the rest. It appears that many minor crashes are no longer being logged by the police (they are supposed to report any crash with injures, or damage above $1000). If someone is injured a report is still made of course. But it looks like many minor fender-benders with no injuries no longer make the database. Can I prove this? No, but the evidence is pretty strong. All causes show an increase in the injury rate, post-COVID versus pre-COVID. Even low-injury collisions like Unsafe Lane Change and Backing Unsafely doubled the injury rate. It’s hard to imagine that people are now changing lanes or backing their cars up with such reckless abandon that they cause twice as many injuries than before COVID. The only logical explanation I can think of is that these crashes are still happening, but that many of the non-injury incidents are no longer being reported. That causes the injuries per crash ratio to grow.
So, as best as I can tell, reckless driving behaviors have increased in New York city, post-pandemic. But the good news is, the roads are still safer than before. You just can’t rely on the raw crash report numbers, at least when comparing pre- and post-COVID.