New York publishes detailed information on every traffic accident – er, motor vehicle collision1A Crash is Not an Accident, that has occurred in the city. The reports go back to July of 2012, so we’ve got more than a decades worth of data.
One of the nice things about this is that about 90% of the reports contain the GPS location of the crash. This has enabled all sorts of clever and powerful tools for visualizing the frequency and location of events. This one is especially fun to play with. I won’t reinvent that particular wheel, but there’s lots of other data to crunch. So let’s get crunching.
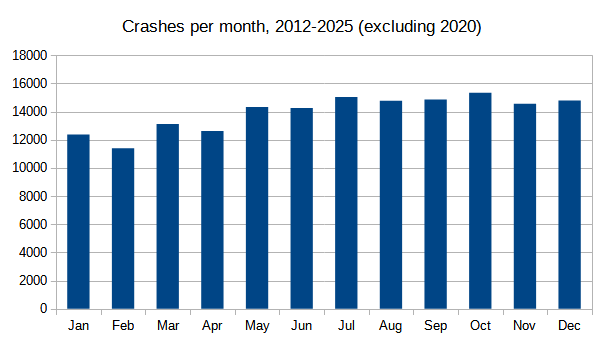
I’ll start with when crashes occur. First, by month:
But of course, we’re not adjusting for traffic volume. We have monthly volume information for the various bridges connecting New York locations – this will have to do as an indicator of overall traffic volume. Here are the crash rates per month, adjusting for the number of vehicles on the road:
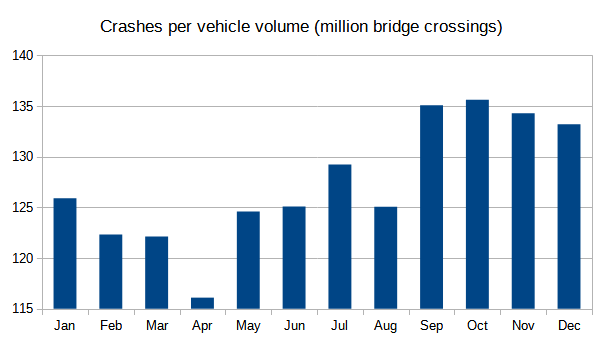
Wow! April is massively safer than other months, right? Well, not so much. I cheated when creating this chart. Look at the scale on the left; I deliberately picked numbers to exaggerate the differences from month to month. Here’s the same data, with a more realistic scale:
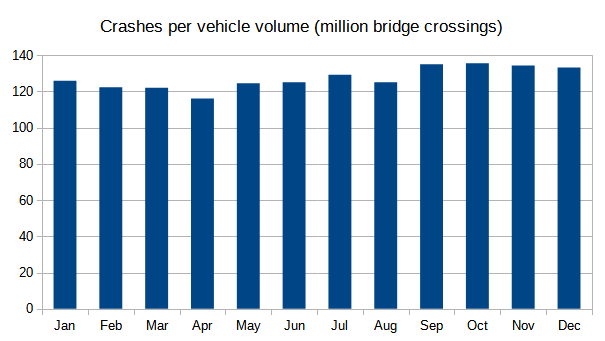
Not as exciting now, right? There is a difference between the lowest month (April) and the highest (October), it’s just not huge: 14%. But that difference is magnified by the scaling “cheat” that I used in the first graphic. Consider this a public service announcement; be on the lookout for “scale hacking”, misleading bar charts that play with the left-hand scale.
Now let’s look at time of day. Here is the crash rate for each of the 24 hours of a day:
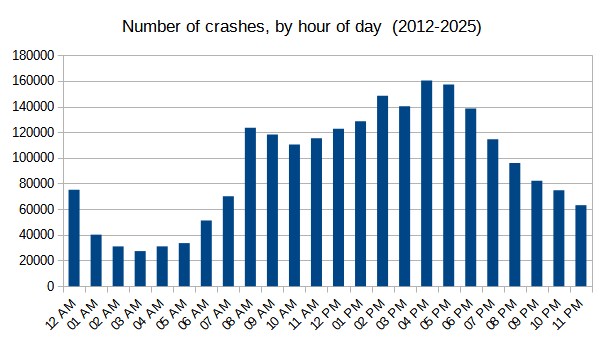
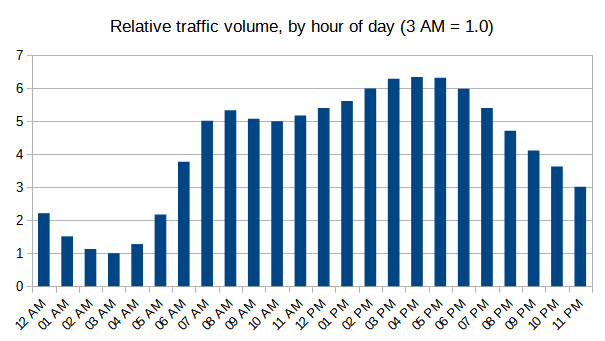
There’s a low number of crashes in the wee hours, a small spike during the morning commute, and maximum during the evening commute. Once again, this is before adjusting for traffic volume. Of course there are fewer incidents at 3 AM – nobody’s on the road! We can deal with this if we have hourly traffic volume data. And we do! NYC provides two sets of traffic volume data, across the whole city (not just bridges). Here is the relative traffic volume by hour of the day. We define 3 AM, with the least volume, as 1.0 on this scale, and all other hours are relative to his.
Thus we can calculate the crash rate, adjusting for the traffic volume:
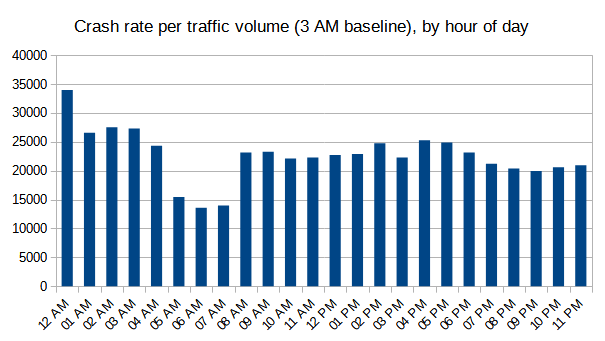
If you’re trying to avoid crashes, the best time to be on the road is 5-8 AM. The riskiest is the midnight hour. All other times carry more-or-less the same risk.
Well, there’s risk and then there’s risk. An crash is unfortunate, but getting injured is worse. So let’s constrain ourselves to crashes that result in injuries or death. This next chart lists the average number of injuries per crash, at different hours of the day
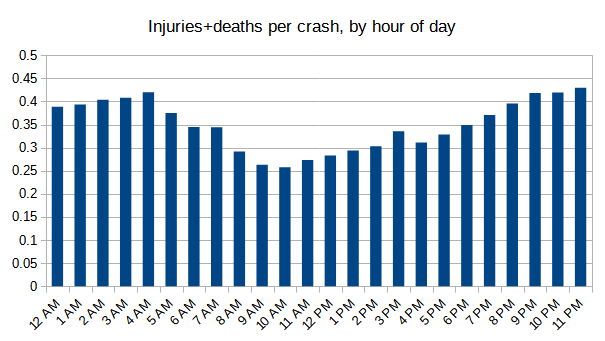
Crashes at night are more likely to result in injuries than those during daylight. A reasonable guess would be drunk drivers; we’ll confirm this next time, when we look at why crashes happen. But to wrap up our when analysis, I’ll do a quick check of days of the week. Turns out there’s not a lot of variation in the number of incidents – weekdays, weekends, not much difference. The one thing that does stand out is the risk of death in a crash:
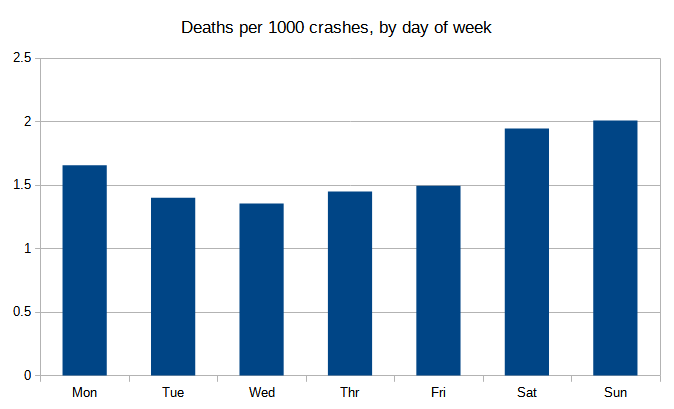
Weekends have 30% higher risk of death. But, Mondays are also higher? Well, early morning Monday is basically a continuation of Sunday night, which is part of the weekend. So again, drunk drivers would seem to be at play here. I’ll dig deeper next time.