New York City has detailed data on traffic crashes over the past 14 years. My previous post looked at the when these incidents occur; mostly the time-of-day. Today I’ll look at why they happen (and okay, also when). Each collision report lists up to five vehicles; for each vehicle, a “contributing factor” can be specified. “Can” is the operative word here: fully one third of the reports do not list a contributing factor. We don’t know whether this is an oversight or the officers weren’t able to determine the cause. In any case, we do have the cause(s) for two thirds of 2.2 million crashes, and that’s a lot. So I’ll roll with that.
Also note that some crashes have multiple causes. It is possible, but not required, to list a cause for each vehicle, so in theory there can be up to five causes. But more than two causes is very rare: only 0.3% of crashes have three or more contributing factors. In those crashes where causes are specified, a single cause is listed about 90% of the time; two causes cover almost all of the remaining 10%.
Here’s the complete list of causes of crashes in New York City, from July 2012 through March of this year.
| Rank | Cause | Count |
|---|---|---|
| 1 | driver inattention/distraction | 563,185 |
| 2 | failure to yield right-of-way | 153,443 |
| 3 | following too closely | 144,762 |
| 4 | other vehicular | 109,571 |
| 5 | backing unsafely | 90,478 |
| 6 | passing or lane usage improper | 79,149 |
| 7 | passing too closely | 67,121 |
| 8 | turning improperly | 64,629 |
| 9 | fatigued/drowsy | 59,500 |
| 10 | unsafe lane changing | 51,799 |
| 11 | traffic control disregarded | 49,904 |
| 12 | driver inexperience | 44,188 |
| 13 | unsafe speed | 41,826 |
| 14 | alcohol involvement | 28,105 |
| 15 | reaction to uninvolved vehicle | 27,634 |
| 16 | pavement slippery | 26,244 |
| 17 | lost consciousness | 26,148 |
| 18 | view obstructed/limited | 19,106 |
| 19 | prescription medication | 18,481 |
| 20 | outside car distraction | 16,081 |
| 21 | oversized vehicle | 15,704 |
| 22 | pedestrian/bicyclist/other pedestrian error/confusion | 14,894 |
| 23 | aggressive driving/road rage | 13,289 |
| 24 | physical disability | 11,662 |
| 25 | passenger distraction | 10,203 |
| 26 | brakes defective | 8,086 |
| 27 | fell asleep | 7,041 |
| 28 | obstruction/debris | 5,533 |
| 29 | glare | 4,958 |
| 30 | illness | 4,639 |
| 31 | other electronic device | 4,394 |
| 32 | failure to keep right | 4,237 |
| 33 | steering failure | 3,393 |
| 34 | tire failure/inadequate | 2,925 |
| 35 | pavement defective | 2,881 |
| 36 | animals action | 1,787 |
| 37 | lane marking improper/inadequate | 1,658 |
| 38 | drugs (illegal) | 1,589 |
| 39 | driverless/runaway vehicle | 1,586 |
| 40 | traffic control device improper/non-working | 1,535 |
| 41 | accelerator defective | 1,304 |
| 42 | tow hitch defective | 283 |
| 43 | other lighting defects | 273 |
| 44 | tinted windows | 265 |
| 45 | headlights defective | 228 |
| 46 | vehicle vandalism | 175 |
| 47 | eating or drinking | 166 |
| 48 | shoulders defective/improper | 120 |
| 49 | windshield inadequate | 98 |
| 50 | listening/using headphones | 42 |
Notes:
- #1 by a landslide is “driver inattention/distraction”. I assume this includes smart phone usage. There is a “looking at electronic device” cause, but it rates way down at #31. I’m pretty sure that many crashes caused by smart phone distraction are given the generic “driver inattention/distraction” category instead.
- #4 “other vehicular”- I suspect that it means the other vehicle caused the crash, so the actual cause is associated with that vehicle.
- If I combine #6 “passing or lane usage improper” and and #7 “passing too closely” into a general category “unsafe passing”, that category jumps to #3 on the list, ahead of “following too closely”
- I hope that in most cases #17 “lost consciousness” is an effect of the crash, not a cause. Otherwise, that means that in New York City five crashes a day are caused by people losing consciousness. That would scare me.
Which are the most dangerous types of crashes? Here are the top six, listed by injuries+deaths per crash:
| Cause | Injuries/deaths per crash |
| pedestrian/bicyclist/other pedestrian error/confusion | 0.82 |
| unsafe speed | 0.74 |
| traffic control disregarded | 0.74 |
| traffic control device improper/non-working | 0.67 |
| tinted windows | 0.66 |
| drugs (illegal) | 0.65 |
Crashes involving a pedestrian or cyclist are going to have a high injury rate – when going up against a car, they always lose. #2 on the list reinforces the old saying, “speed kills”. Running red lights (#3) isn’t healthy either, apparently. No idea why tinted windows is on this list – I mean, I can see why they cause crashes (vision reduction), but why those crashes would be more dangerous than average, I can’t say.
One thing not on this list is drunk driving. It rates at 0.51 injuries/deaths per crash, which is above average (0.37) but not even in the top ten. Kind of surprising.
At the other end of the spectrum, here are the safest types of collisions:
| Cause | Injuries/deaths per crash |
| oversized vehicle | 0.10 |
| passing too closely | 0.11 |
| backing unsafely | 0.13 |
| tow hitch defective | 0.17 |
| prescription medication | 0.20 |
The first three are your basic slow-speed fender-benders. A defective tow hitch is more obscure, but again this is probably going to happen at slow speeds. As for the final one on this list, it’s clear that some prescription meds can slow reaction time and cause drowsiness, leading to crashes. But why “safer” collisions? Here’s a guess – people affected by prescription meds realize this, and adjust their driving speed accordingly. Just a guess.
Alright, let’s add another variable: when a crash happens. I’ll start with day of the week. Most causes are equally likely on every day of the week. For example, “driver inattention” is just as likely to cause a crash on a Monday as a Saturday. But let’s look for causes that happen more on weekends. Start with the obvious choice, drinking:
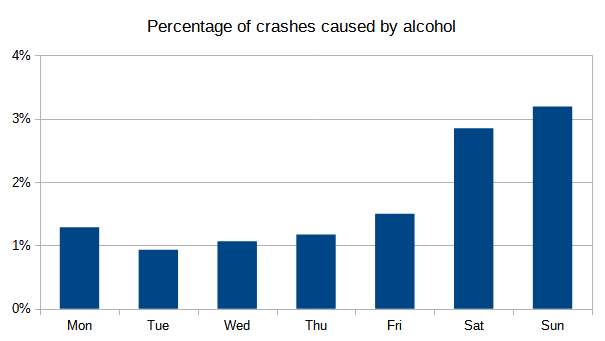
No surprise there. There’s more speeding on the weekend too:
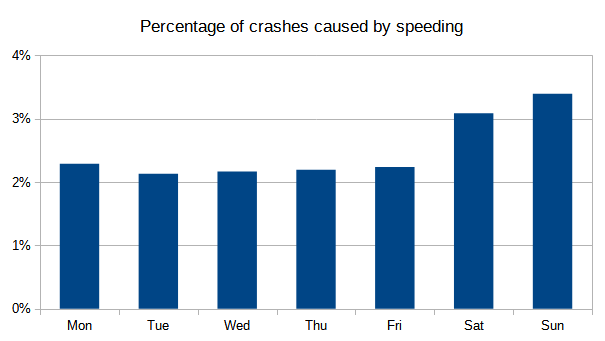
My guess: no commute -> fewer cars on the road -> more speeding.
Are there crash types that happen more on weekdays? The only cause that stands out is “oversized vehicle”, which makes sense – during the week there are more construction trucks and delivery vans on the road.
Next we’ll look at how time of day affects the crash rates for difference causes. I’ll start with the usual suspect: drunk driving:
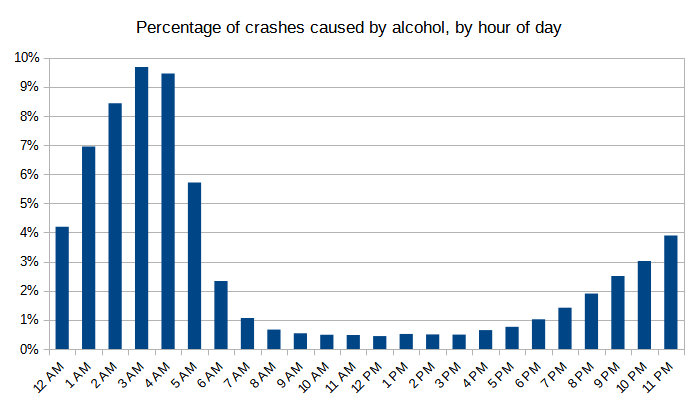
It’s 22 times more likely that a crash at 3 AM is caused by alcohol impairment then one at noon.
Here’s a chart that captures crashes caused by fatigue/drowsiness or falling asleep at the wheel:
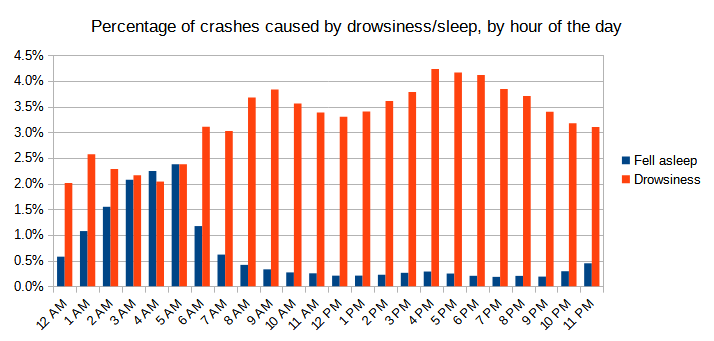
The red bars represent crashes caused by driver being fatigued or drowsy. This can happen any time of day, but it peaks in the late afternoon or early evening. The blue bars represent the driver actually falling asleep – this almost always happens in the early morning hours. Interestingly, you can add these two causes together and get the overall “sleep-deprived” crash rate:
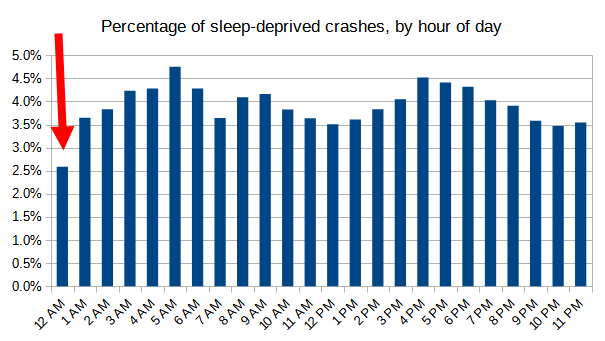
Strangely, the hour that has the fewest sleep-deprived crashes is midnight to 1 AM (34% fewer than the next lowest hour). I did not expect that.
Remember how we saw that there were more speeding-related crashes on weekends? My theory is that there are fewer vehicles on the road, allowing people to drive faster. Turns out the hour-of-day chart for speeding is also edifying:
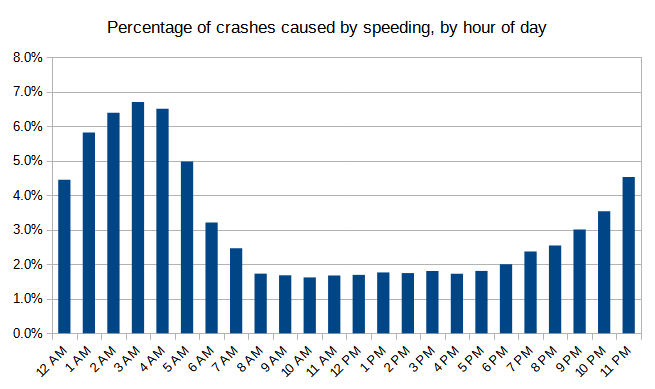
This chart is almost exactly the inverse of the traffic volume by hour. Thus there is a very high inverse correlation between traffic volume and crashes caused by speeding (r2 = 0.94). So it could be as simple as: fewer cars on the road leads to more speeding, and more crashes caused by speeding. Of course, correlation is not causation; there might be a third factor involved.
Incidents caused by aggressive driving follow this same pattern – higher in the low-traffic evening hours1although the correlation is not as strong, r2 = 0.70. So again, it could be that emptier streets leads to faster, more aggressive driving, and more crashes. Or, it could be that people who drive at night are more likely to be reckless. In any case, nighttime drivers are not at their best behavior.