When comparing the results of two consecutive presidential elections, we can calculate the swing of each county: how much the vote changed from the previous election. If in 2016 a random county was D+8 and last year it was D+4, that’s a 4 point swing toward R. Typically, across all 3000+ counties in the US, these swings aren’t huge, averaging around 7 points.
But that’s just the average; swings for individual counties are sometimes huge, and that’s what we’re looking at today. What does it mean, for example, when a county that was 50/50 in one presidential election swings to 65-35 the next? What’s the cause of this “sudden swing”, and what does it mean for the future? We’ll use the Adjusted Trend metric, discussed in my previous post, which is a measure of how much the vote changed from the previous election, adjusted for the national lean. We want to look at counties that had significantly large adjusted trends in a given election.
How large are we talking about? It turns out that depends on whether it’s a swing toward the Democrats or Republicans. This table lists number of times a county had a swing of a given size or larger, in the past seven elections (dating to 1996):
| Toward Republicans | Toward Democrats | |
| Swing > 20 points | 1103 | 59 |
| Swing > 25 points | 484 | 21 |
| Swing > 30 points | 170 | 9 |
That’s quite a dichotomy between Rs and Ds; we’ll discuss the reasons for this below. For now, let’s start with the Republican side of things. We’ll analyze GOP swings greater than 25 points (if you use 20 or 30 points as the cutoff, the results are similar). This has happened 484 times in the past seven elections, but it isn’t evenly distributed. It’s heavily concentrated when there is no incumbent running:
| Incumbent running (1996, 2004, 2012, 2020) | 59 |
| No incumbent (2000, 2008, 2016) | 425 |
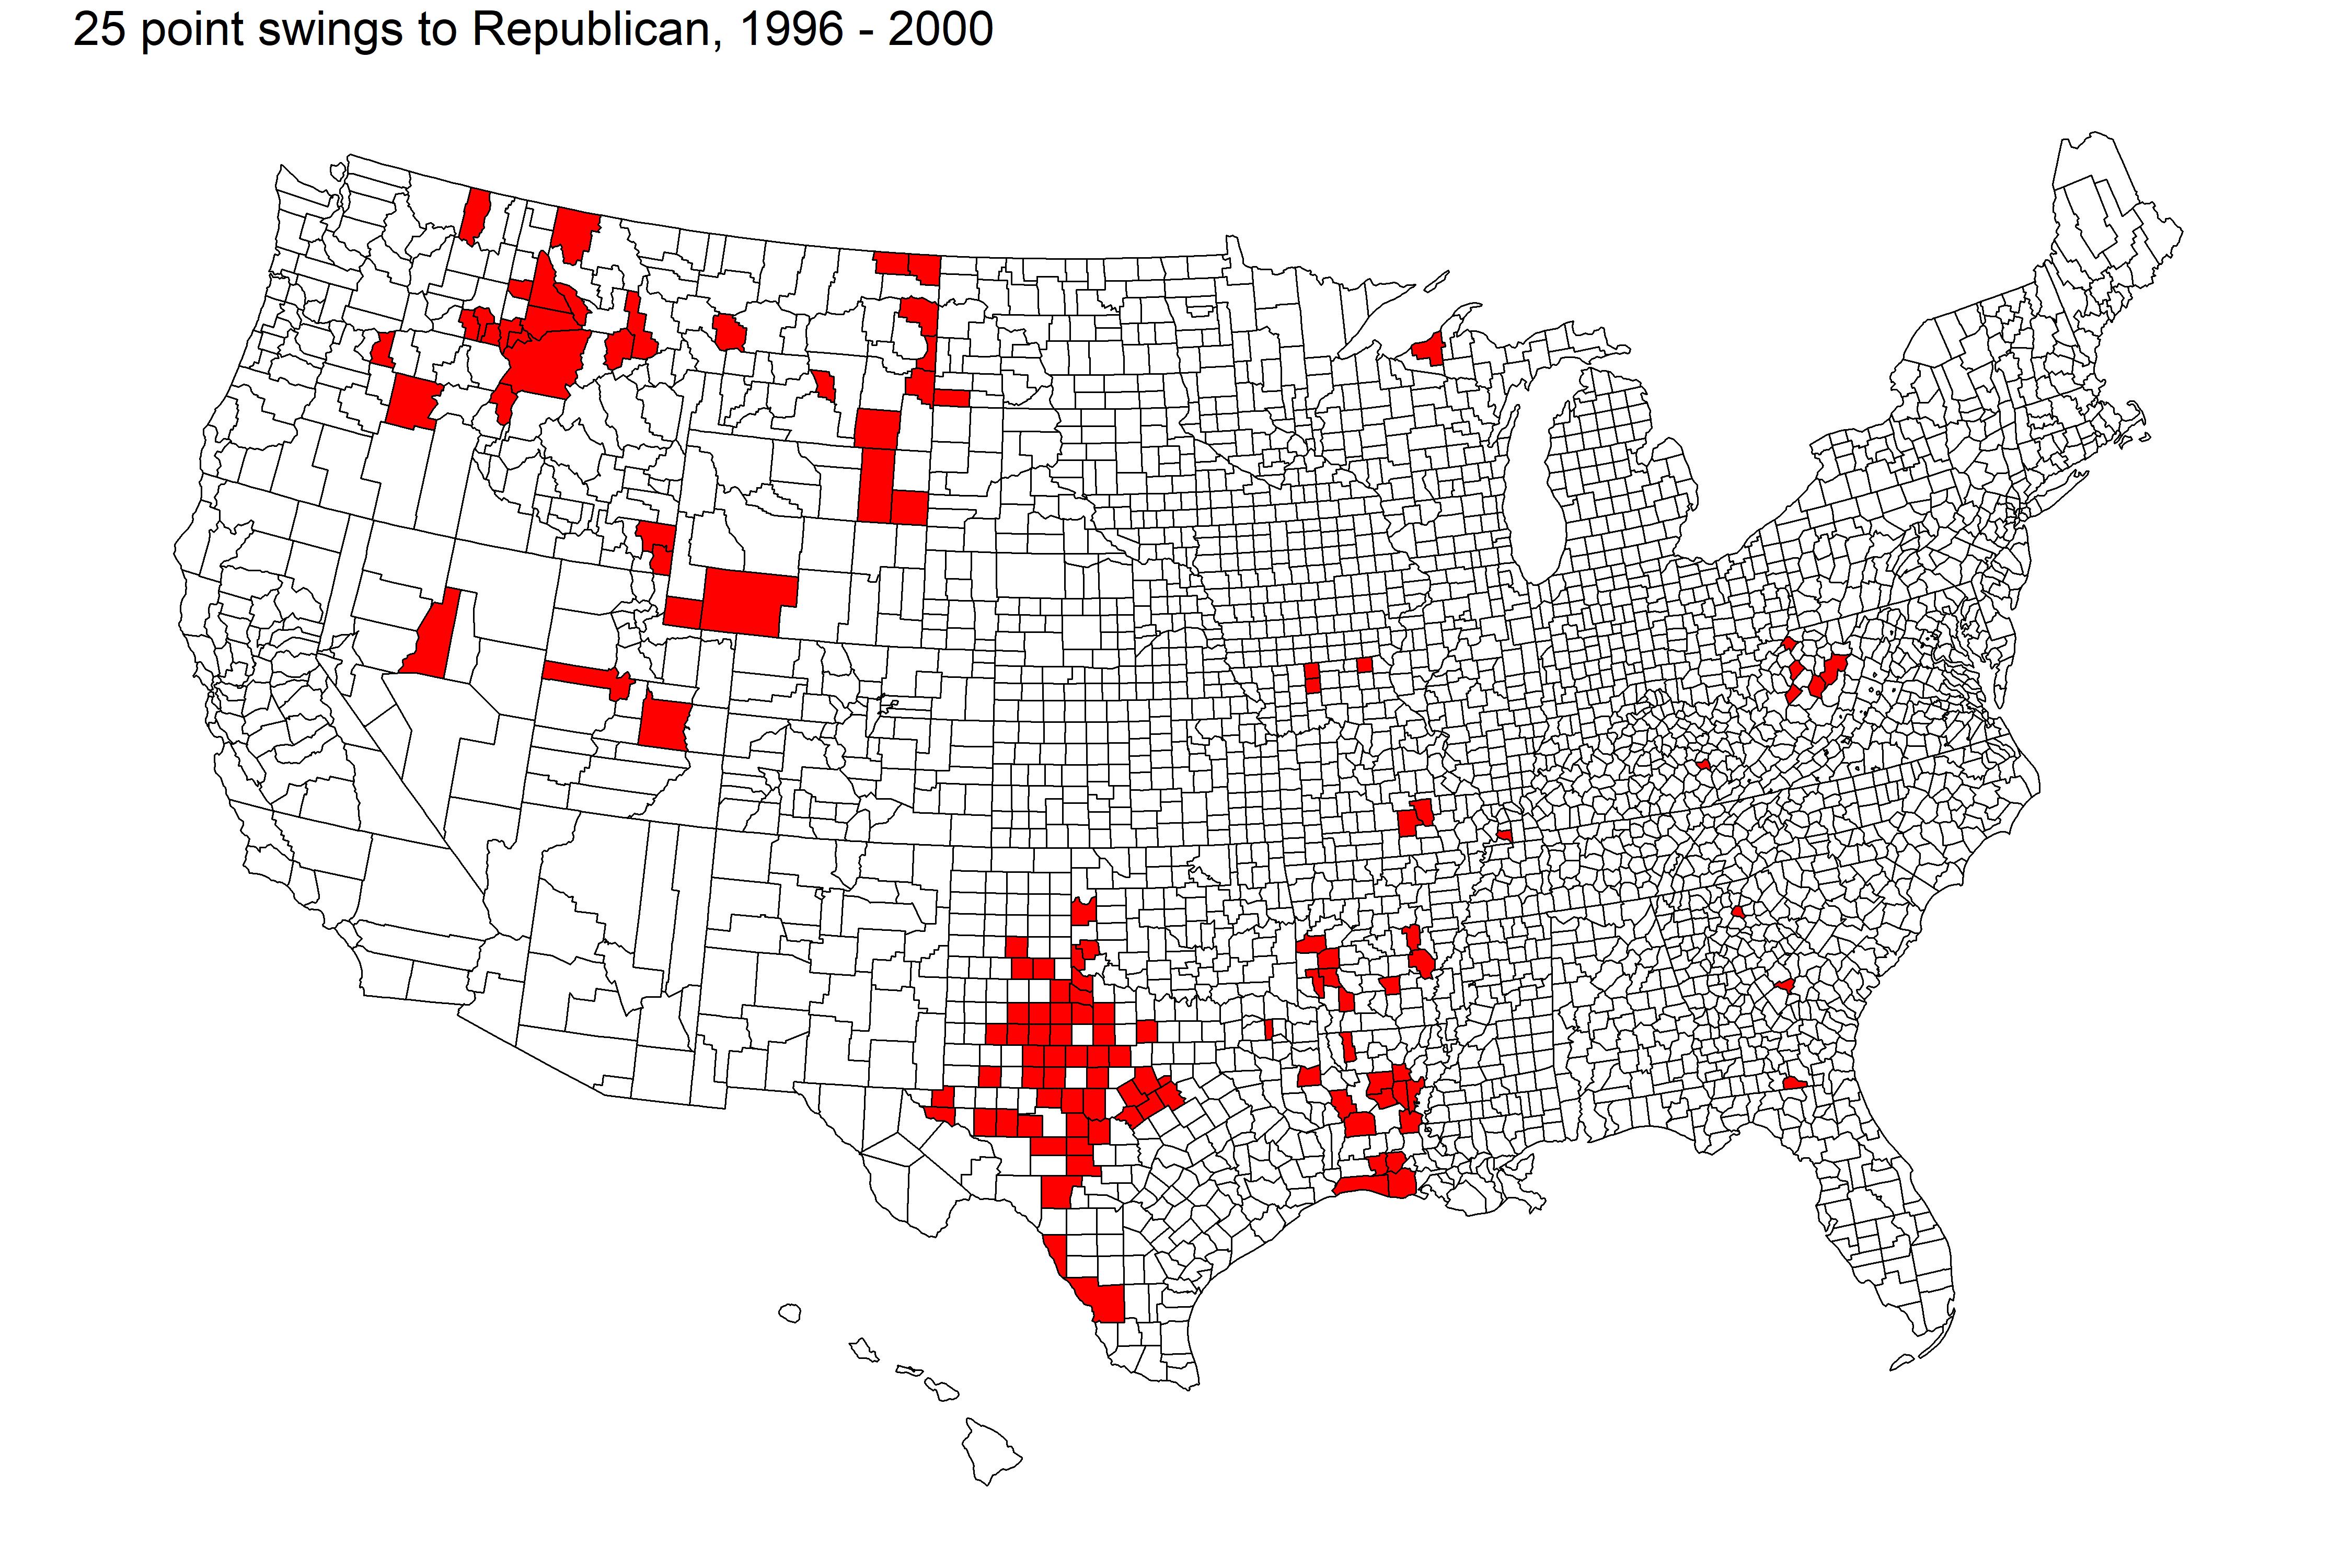
That would seem to be too great of a difference to be just random – about 10 times as many sudden swings in races without incumbents. Why would a “no-incumbent” race cause a large number of counties to swing heavily right? Let’s take a dive into each of the three races of this type, and look at which counties had the sudden swings. First, 2000 (Bush vs. Gore):

Ah, this makes sense: most of the counties are in Texas, and the Western mining/drilling states. Texas, because “favorite son” George W. Bush was on the Republican ticket. And with noted environmentalist Al Gore as his opponent, it’s easy to see why those western counties swung hard to the right.
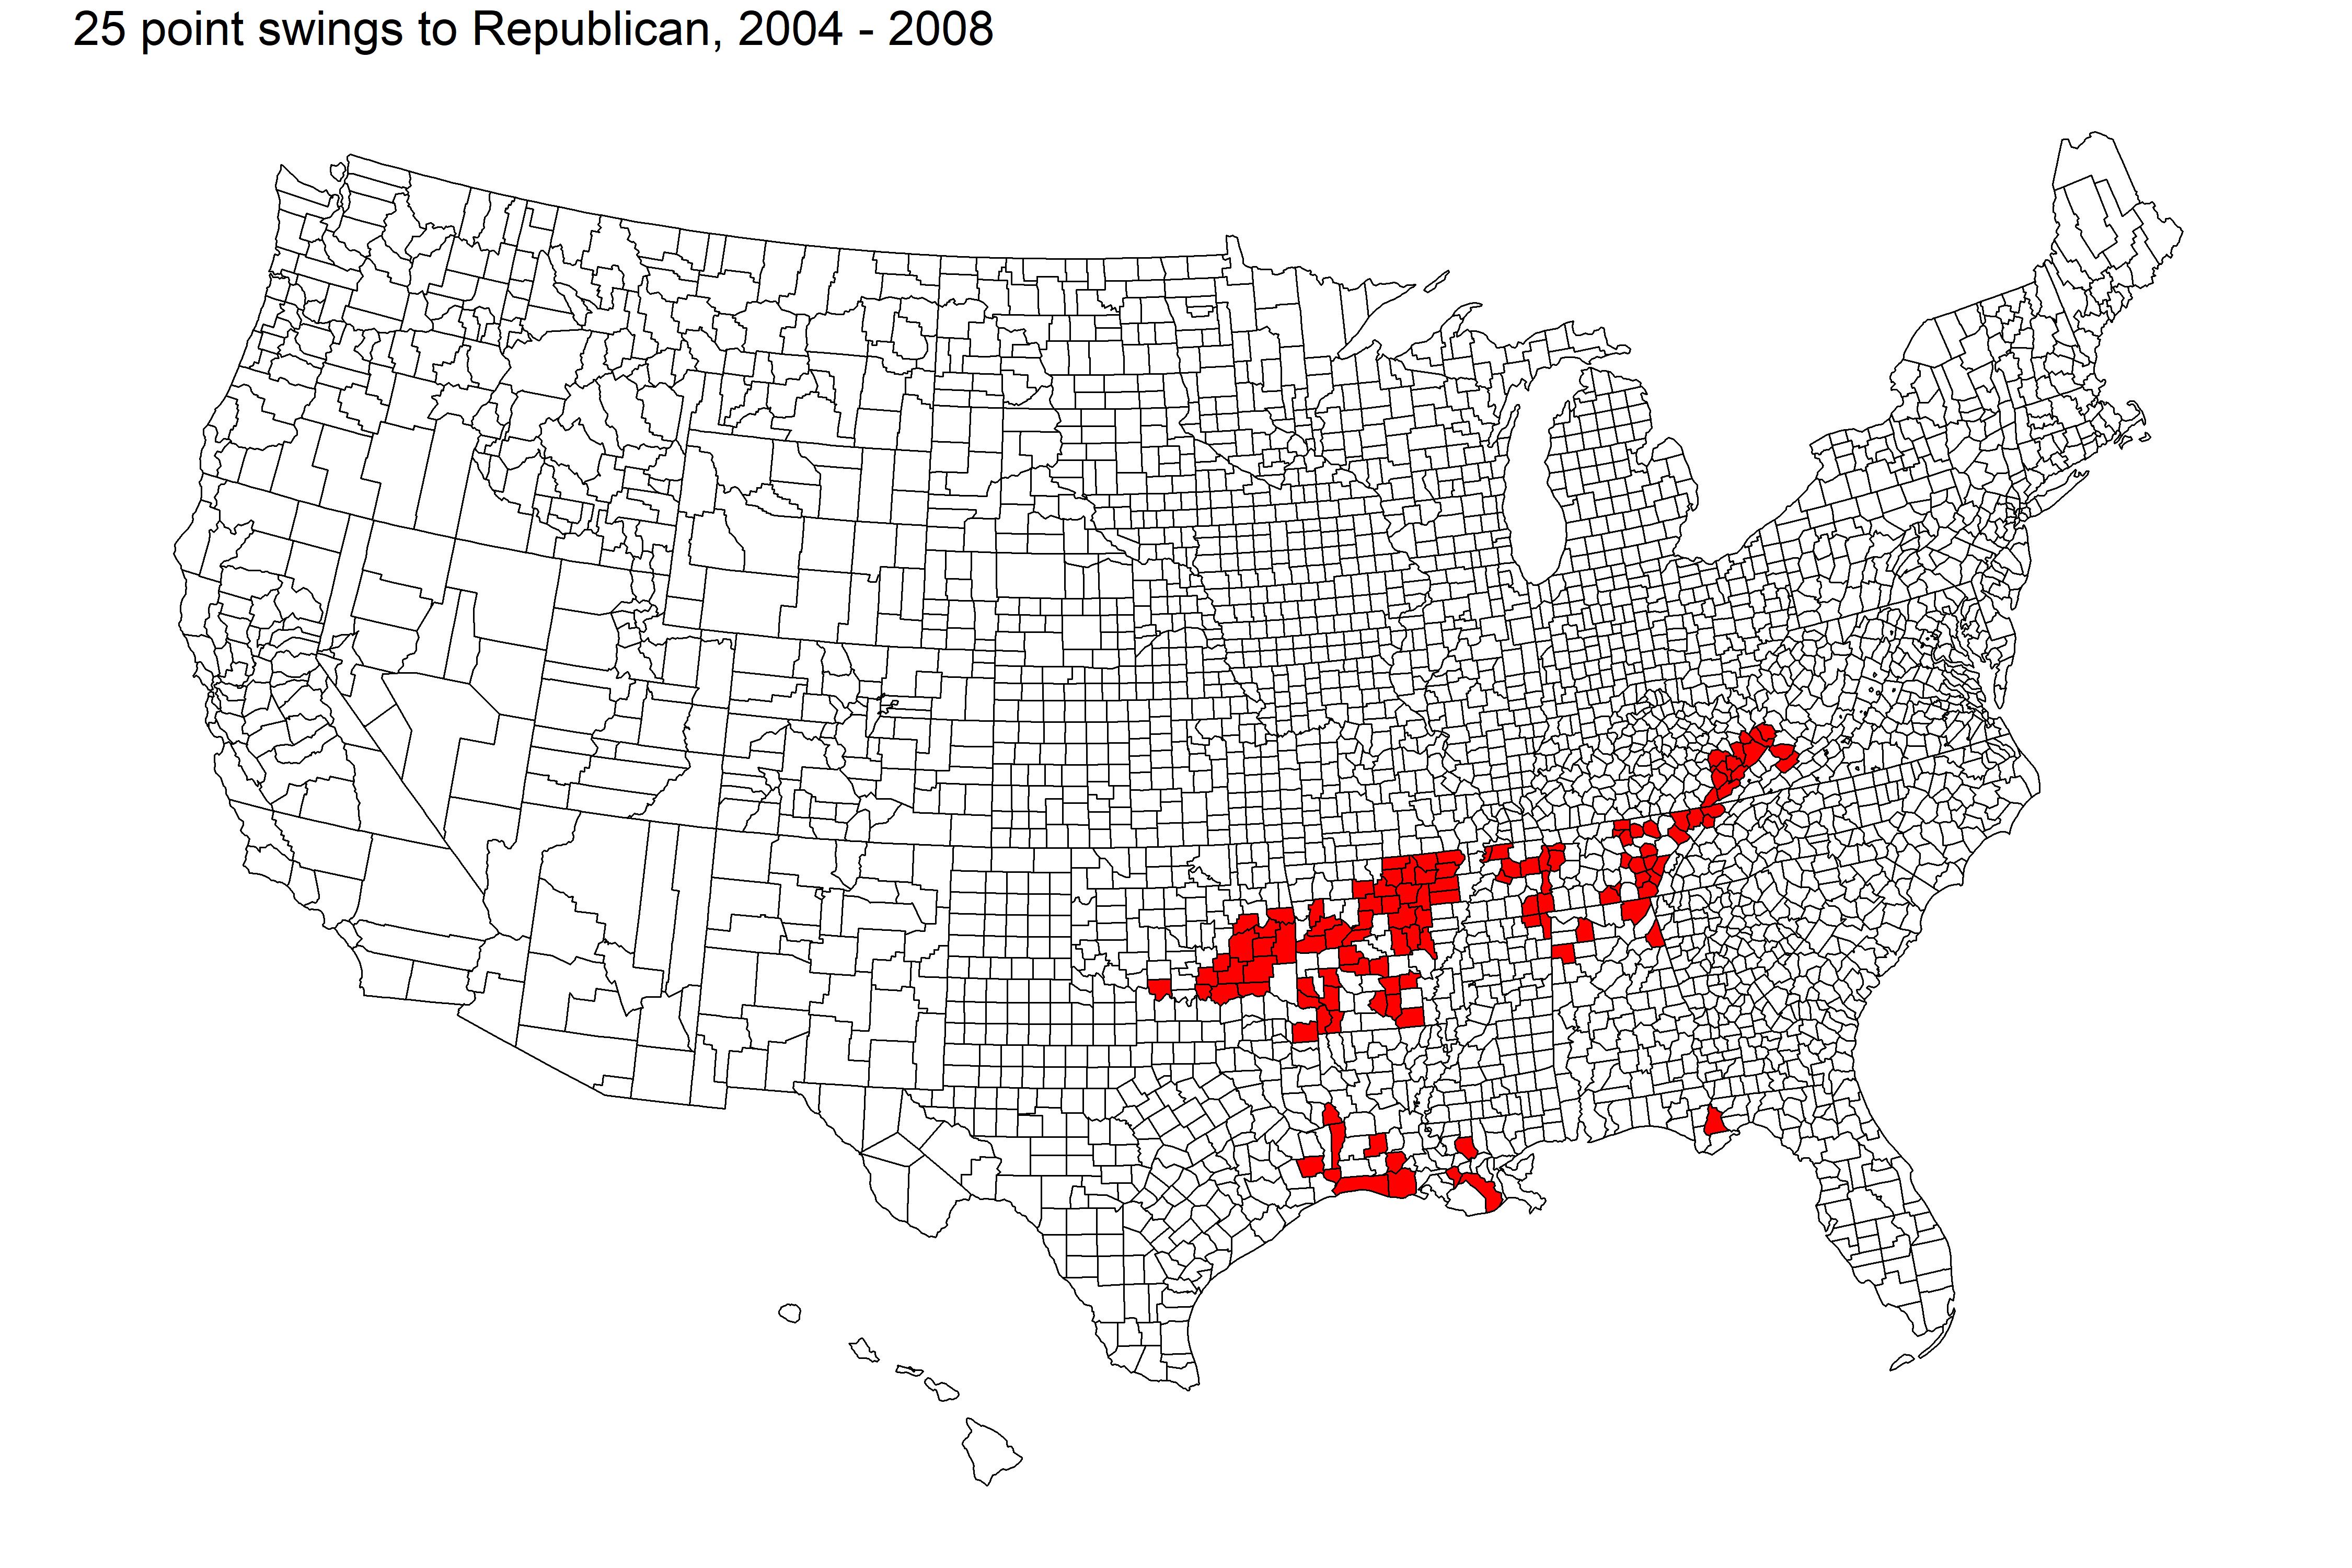
Next, 2008:

In 2008, the Democrats nominated an African-American, and all of the big swings occurred in ex-Confederacy states. I hate to say it, but this looks like old-fashioned racism.
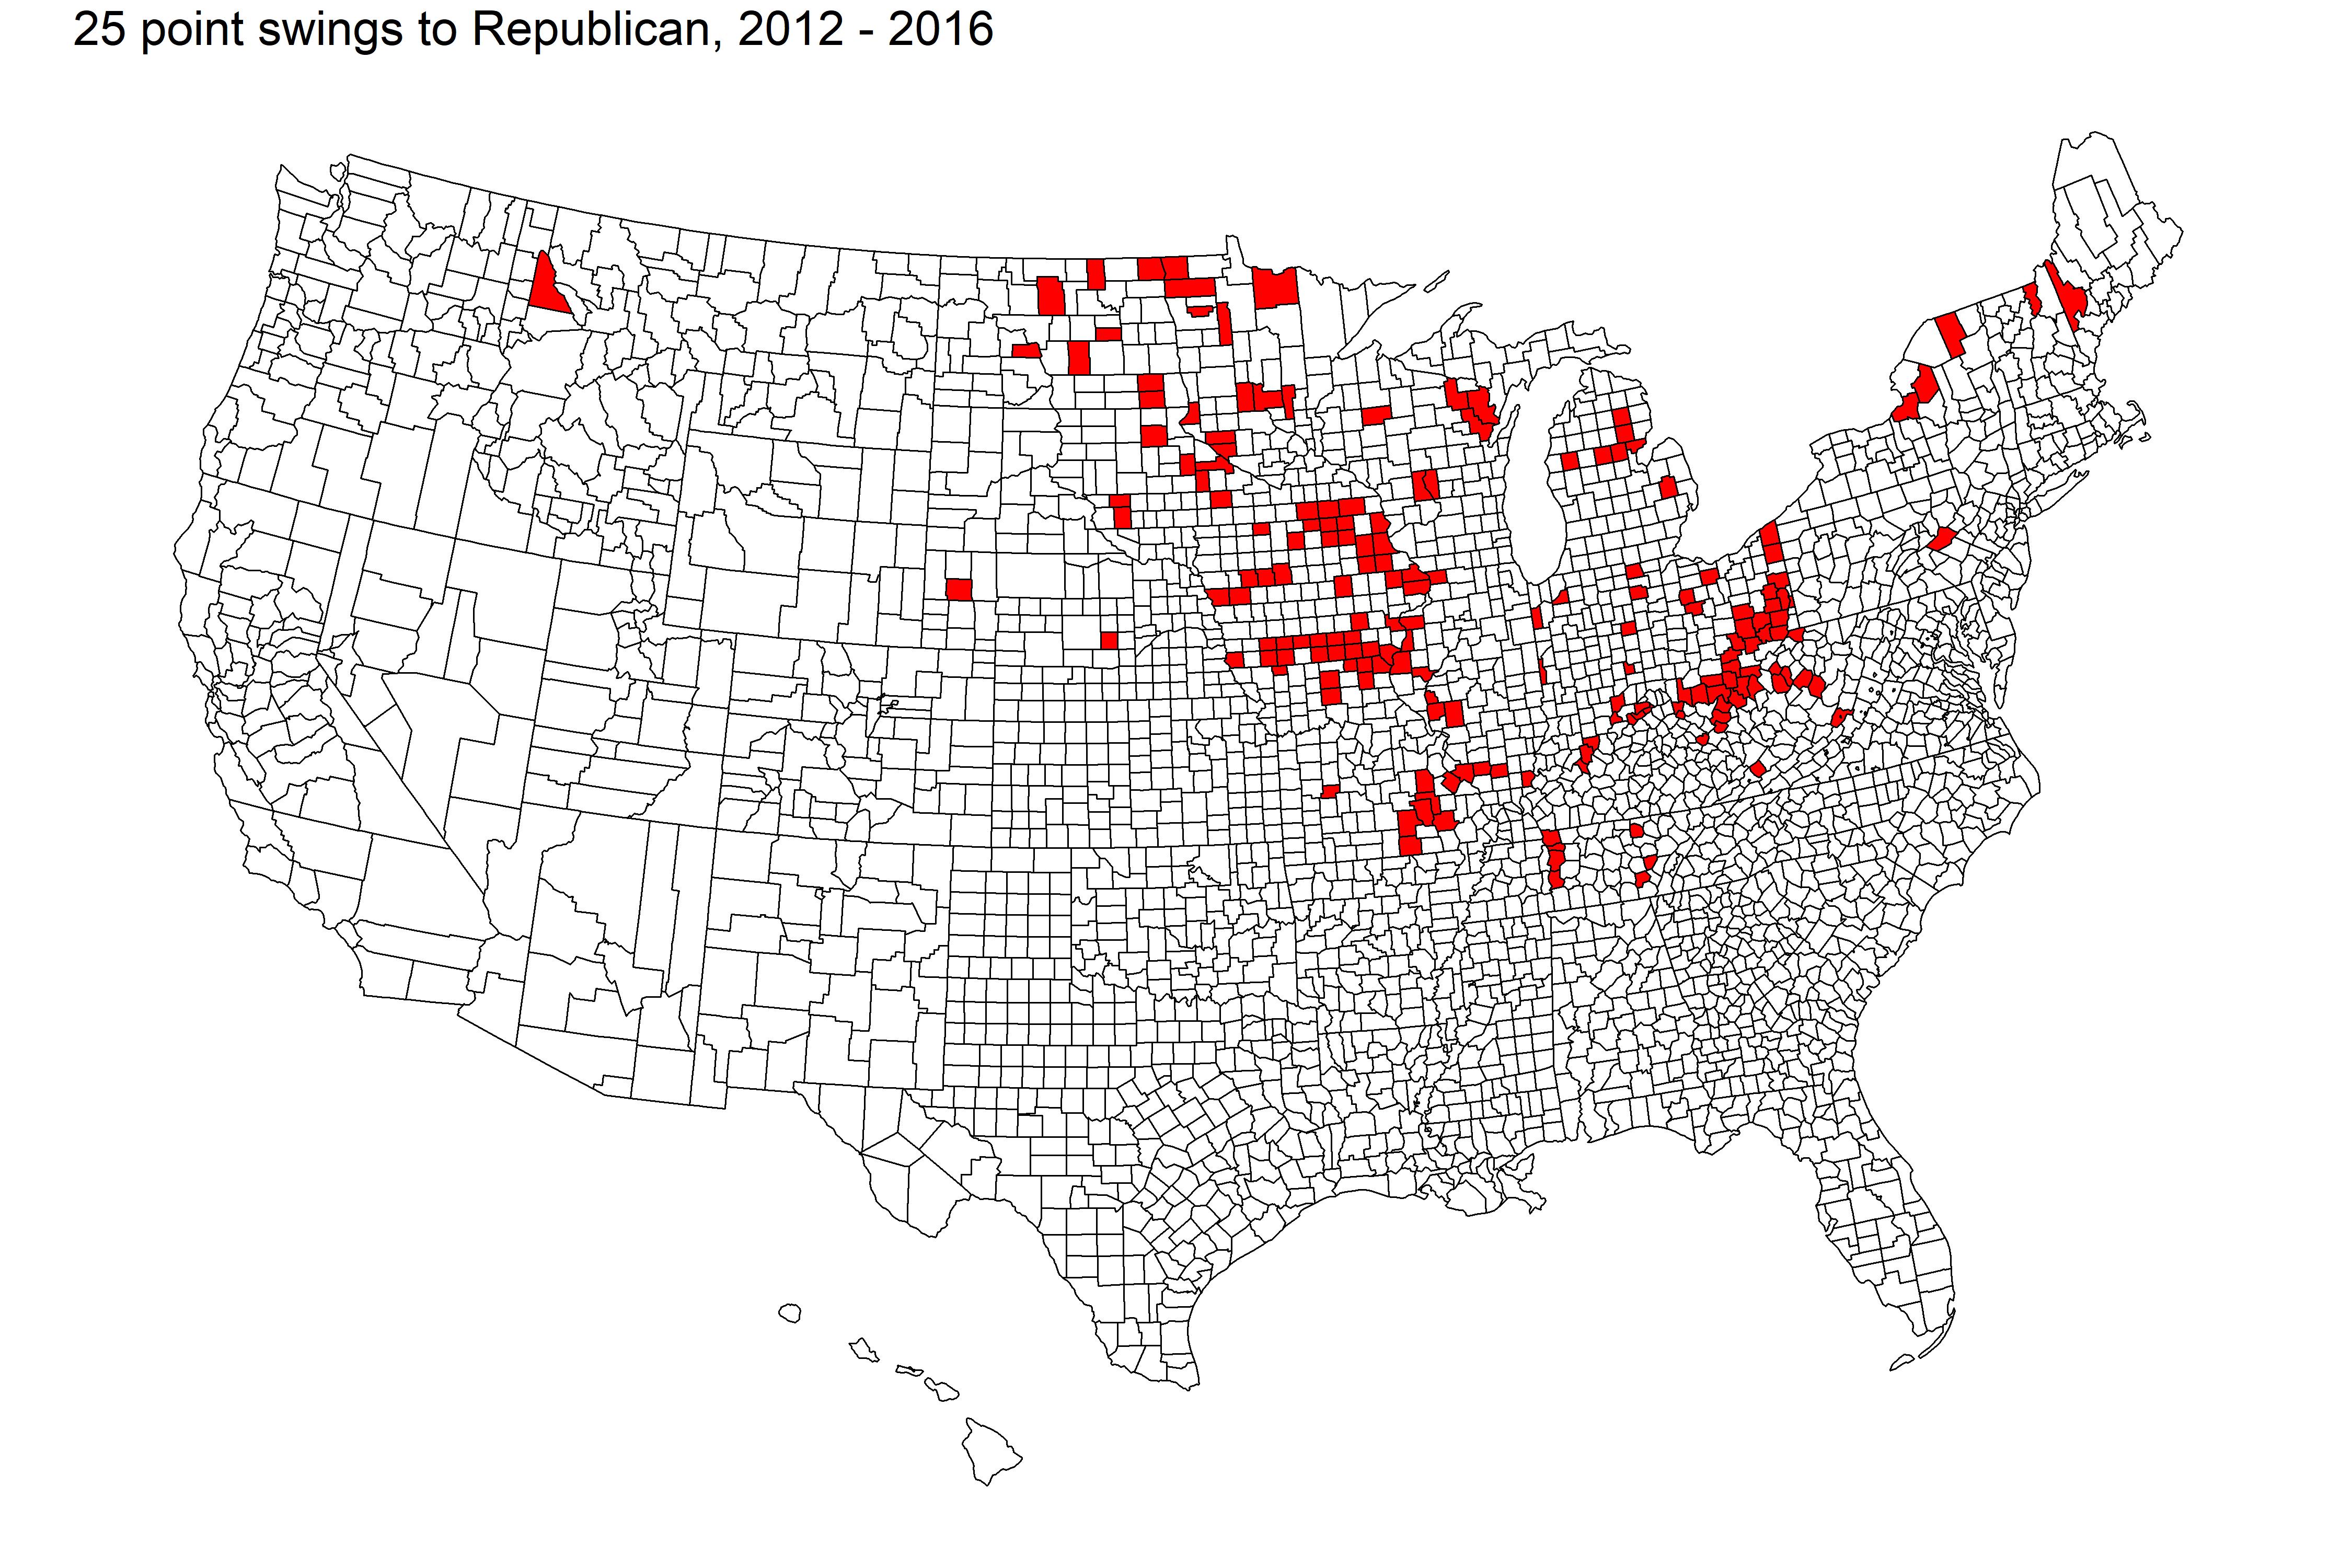
And, 2016:

This was Donald Trump breaking the Democrats’ midwestern “blue wall” in a big way. No surprises here: we all know that the Midwest turned to Trump in a big way in 2016.
So that explains it. In each of those three elections, there just happened to be one or two things about the candidates that caused certain counties to swing toward Republican in a big way. The candidates were “new” (Bush, Obama, Trump), and the swings were big. In each of the follow-on elections the same candidates (now incumbents) were known quantities and sudden swings didn’t happen.
Now, what happens to these same counties in the elections that follow? Do they bounce back toward the Democrats, or continue drifting red? Here’s the answer:
| Number of elections after >25 point R swing | Number of counties | Average Additional Swing to R |
| 1 | 470 | 4.8 |
| 2 | 288 | 13.2 |
| 3 | 273 | 19.1 |
| 4 | 155 | 21.7 |
| 5 | 153 | 27.0 |
| 6 | 28 | 20.2 |
Here’s how to read this. Each row represents the data for a follow-on election for the sudden swing event (1, 2, 3,.., 6 elections later). The next column is the number of counties involved. The Average Additional Swing is how much more the counties have swung toward Republican, in addition to the first 25+ point swing. Let’s look at row 4 as an example. In the elections of 1996, 2000, and 2004, 155 counties swung 25 or more points toward Republicans. Four elections later (2012, 2016, or 2020), these counties have swung, on average, an additional 21.7 points toward Republicans.
The take-home is this: counties that swing 25 or more points toward the Republican candidate in a given election will average an additional 20+ point swing in that direction within the next 3 elections. That means the sudden swing isn’t just a one-time occurrence; it’s a true realignment.
As we saw in the first table, Democrats don’t get sudden swings of that magnitude. I think this has to do with the size of counties. Small counties (in population) tend to be rural; rural counties have trended Republican in recent elections. And no matter what the reason, it’s a lot easier to get a 25-point swing in a population of 4000 than 400,000; the county of 4000 is more homogenous in demographics, jobs, culture, etc., and thus could turn on an issue or two (For example, a proposed ban on fracking could be a deal-breaker for most people in a small county that is heavily invested in it, whereas in a big city that’s just one issue of many).
If we set the cutoff for Democrats to a 12-point swing, we get similar number of data points as with the 25-point cutoff for Republicans. As for what happens to these counties in follow-on elections:
| Number of elections after >12 point D swing | Number of counties | Average additional swing to D |
| 1 | 390 | 2.2 |
| 2 | 315 | 7.5 |
| 3 | 306 | 10.1 |
| 4 | 182 | 2.3 |
| 5 | 67 | 4.5 |
| 6 | 55 | 14.7 |
They continue to swing blue, but nearly as strongly or consistently as the red swing we saw above. But again, these are larger counties, so the swing doesn’t have to be as large to still provide as many votes. When counting total votes, these two are equivalent:
- a 20-point Republican swing in each of five small (4000 voter) counties
- a 10-point Democratic swing in a single, large (40,000 voter) county.
In summary: sudden swings are portents of even more trending in the same direction.
What about 2020? There were very few sudden swings last year. For the Republicans, there were the Texas border counties discussed in my previous post. For the Democrats, there were just three counties with sudden swings, but two of them were in Georgia – good news for the Dems for trying to hold this state in 2024.
