Today I’ll be talking about Adjusted Trends. As you may recall, Adjusted Trend compares how county voted from one election to the next, adjusting for the national lean. This determines which way they are swinging (i.e., becoming more Democratic or Republican). For example, Yamika county in Washington state in 2016 was R+13.1 and in 2020 it was R+7.7. That’s a trend toward Democrats of 5.4 points. But since the country as a whole trended 2.4 point toward D (Clinton won the national vote by 2.1; Biden by 4.5), the adjusted trend for Yamika was 3 points blue (5.4 – 2.4 = 3). Even though it is a red county, it trended blue in 2020.
Let’s start with the ten counties with the biggest trends toward Republicans:
| County | State | 2016 Lean | 2020 Lean | Adj Trend |
| Starr | TX | D+60.2 | D+5.0 | R+57.5% |
| Maverick | TX | D+55.8 | D+9.5 | R+48.7% |
| Kenedy | TX | D+8.1 | R+32.0 | R+42.4% |
| Jim Hogg | TX | D+56.9 | D+17.9 | R+41.3% |
| Zapata | TX | D+32.9 | R+5.3 | R+40.6% |
| Duval | TX | D+35.2 | D+2.6 | R+34.9% |
| Brooks | TX | D+51.0 | D+19.0 | R+34.4% |
| Reeves | TX | D+7.6 | R+23.3 | R+33.2% |
| Webb | TX | D+51.0 | D+23.3 | R+30.1% |
| Edwards | TX | R+41.3 | R+68.0 | R+29.1% |
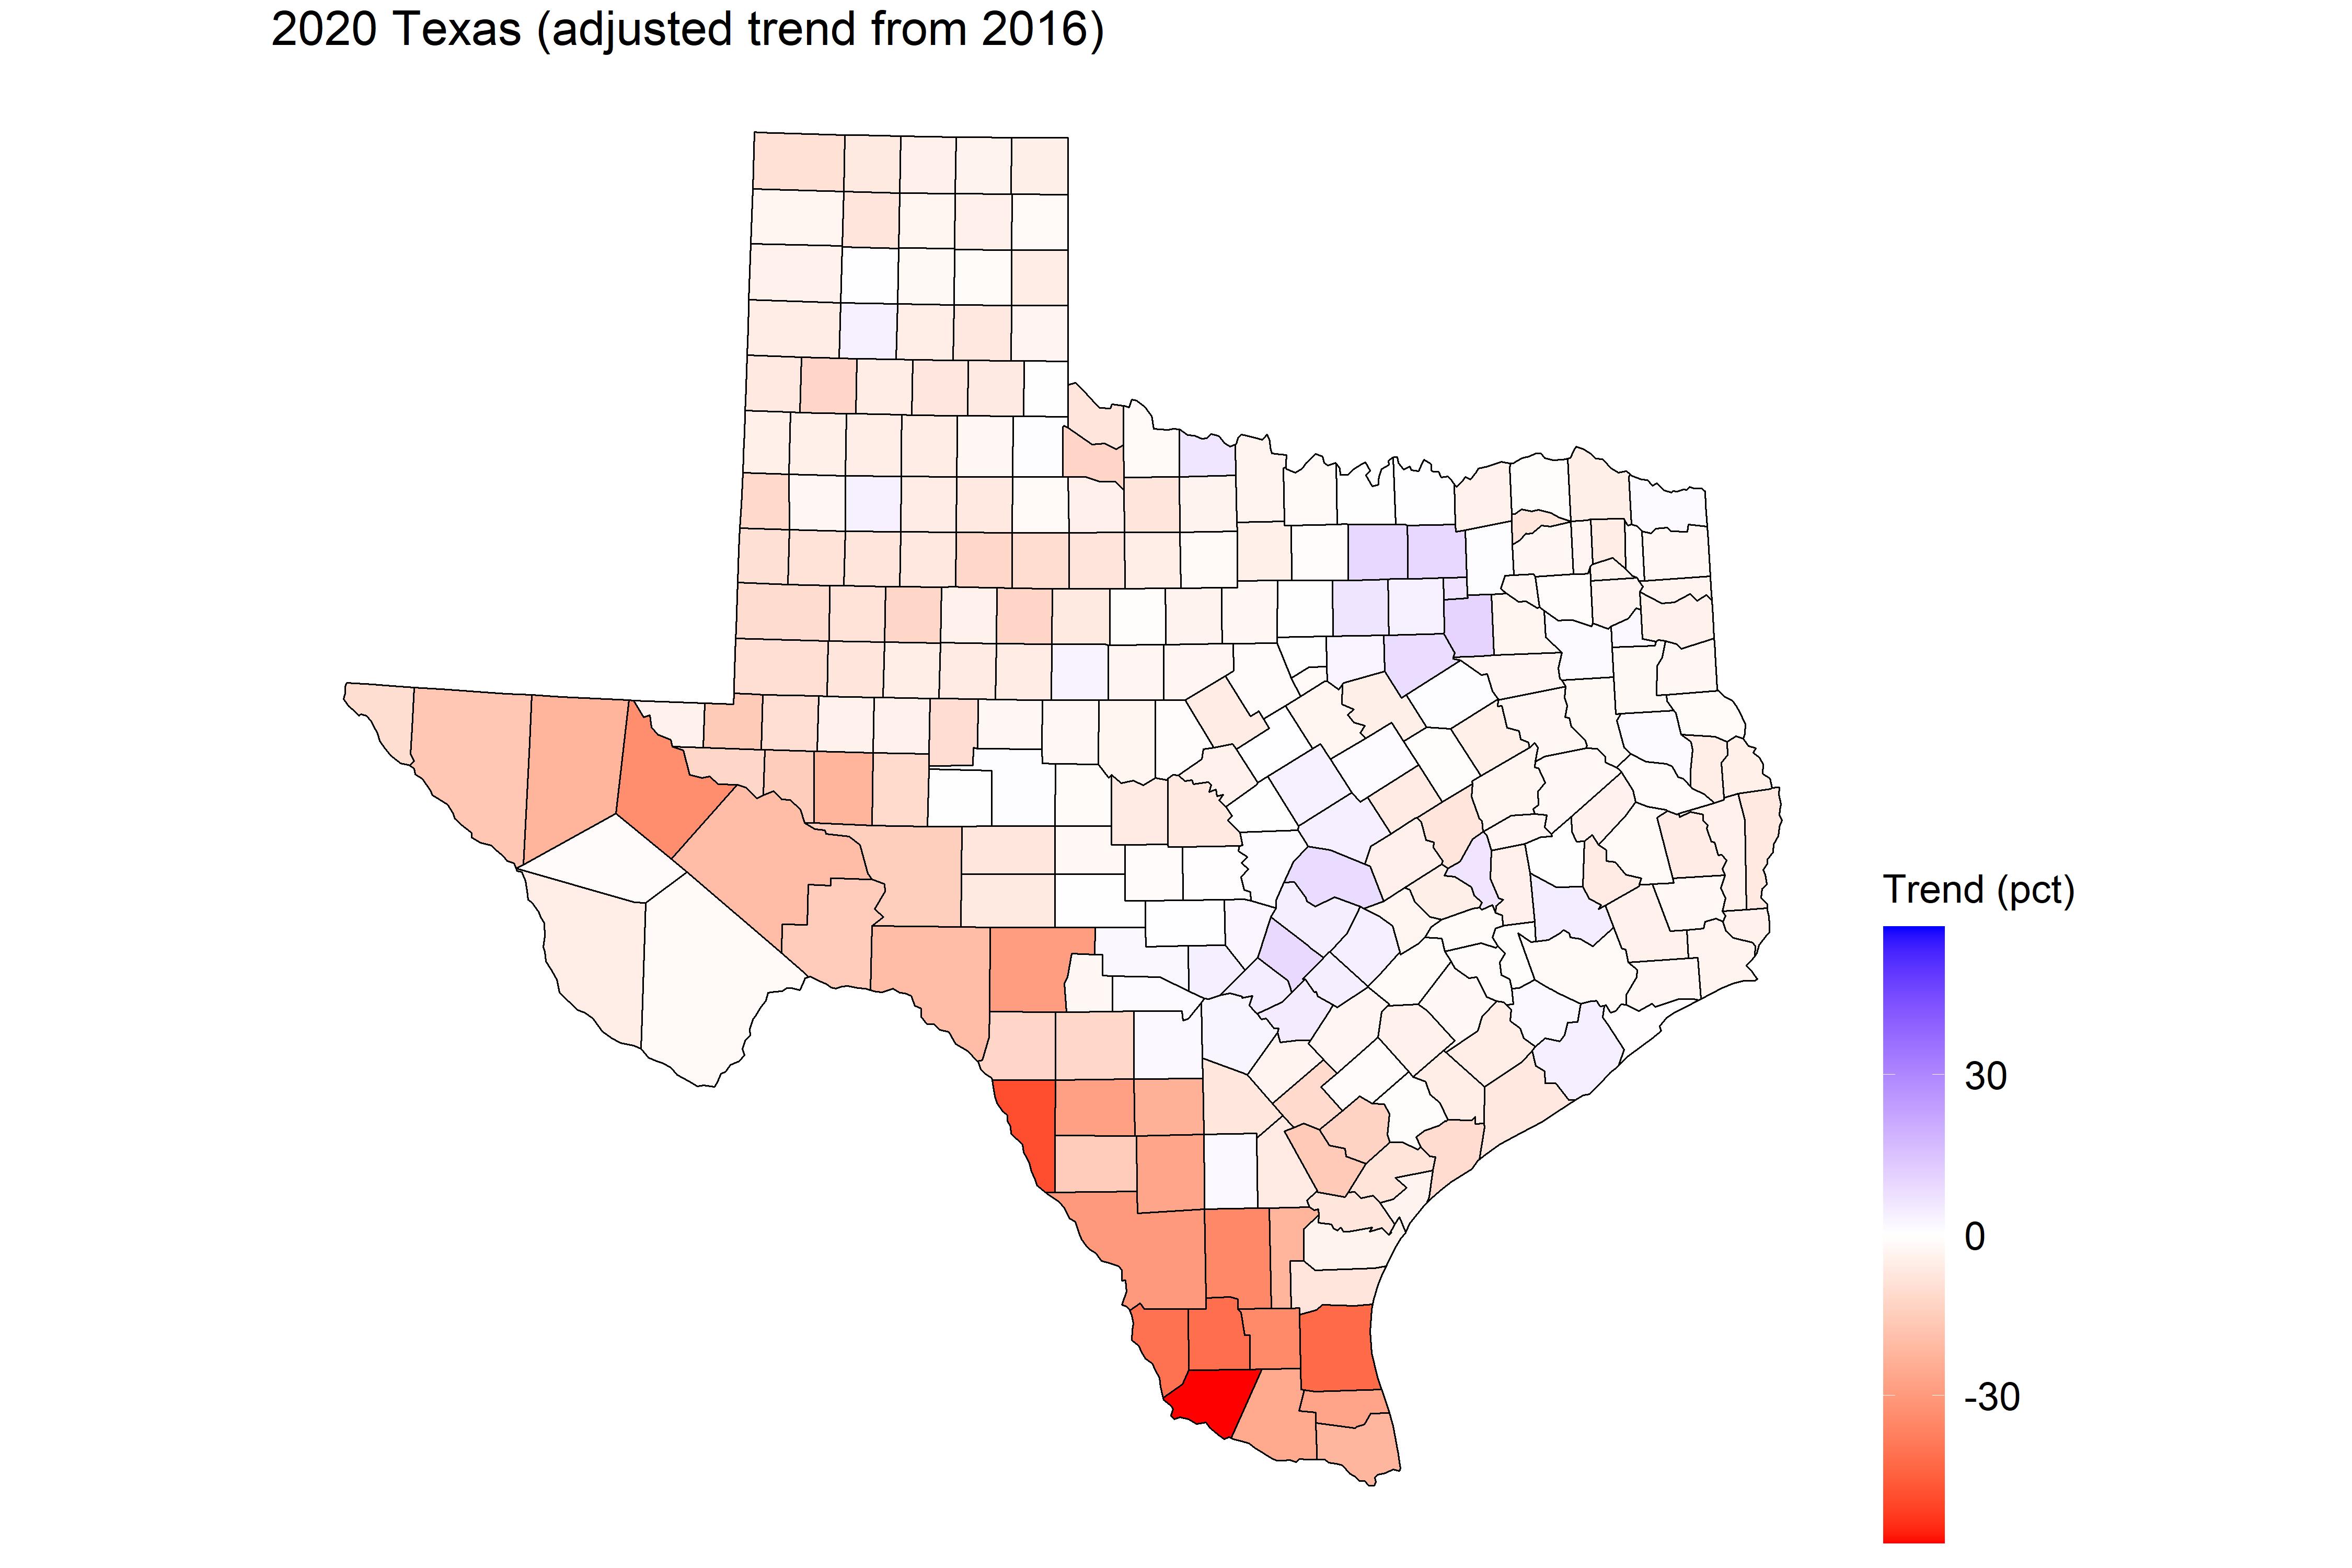
Yep, all ten are from Texas (as are nine of the next ten!). This is the massive swing toward Trump found in Texas border counties. Biden still won several of these counties, but by much smaller margins than 2016. The Adjusted Trend map of Texas shows just how big this swing was, and where it was located:

One thing to realize is that most of those counties are on the small side. Their swing toward Trump was not the difference in keeping Texas in the Republican column. In 2016, Texas was R+9.0; last year Biden picked up 3.4 points to narrow it to R+5.6. If all of those border counties voted as they had in 2016, the lead would have narrowed an additional 1.1 points, to R+4.5. Another way of looking at it, is that the 1.1 points Biden lost to those counties is small compared to the 4.5 points he picked up around the rest of the state.
Still, those are votes the Democrats probably need if they want to flip this state. So it is worth considering whether this a one-time deal, or are these swings portents of a realignment of these voters. That’s the topic of a future post.
Here are the biggest trend swings on the Democratic side:
| County | State | 2016 Lean | 2020 Lean | Adj Trend |
| Henry | GA | D+4.4 | D+20.5 | D+13.8 |
| Rockdale | GA | D+25.7 | D+40.8 | D+12.8 |
| San Juan | CO | D+9.9 | D+24.9 | D+12.7 |
| Douglas | GA | D+10.7 | D+25.1 | D+12.0 |
| Forsyth | GA | R+46.9 | R+33.2 | D+11.3 |
| Inyo | CA | R+13.4 | D+0.1 | D+11.1 |
| Kaufman | TX | R+46.8 | R+33.9 | D+10.5 |
| Hamilton | IN | R+19.3 | R+6.8 | D+10.2 |
| Gwinnett | GA | D+5.8 | D+18.3 | D+10.1 |
| Fayette | GA | R+19.1 | R+6.8 | D+10.0 |
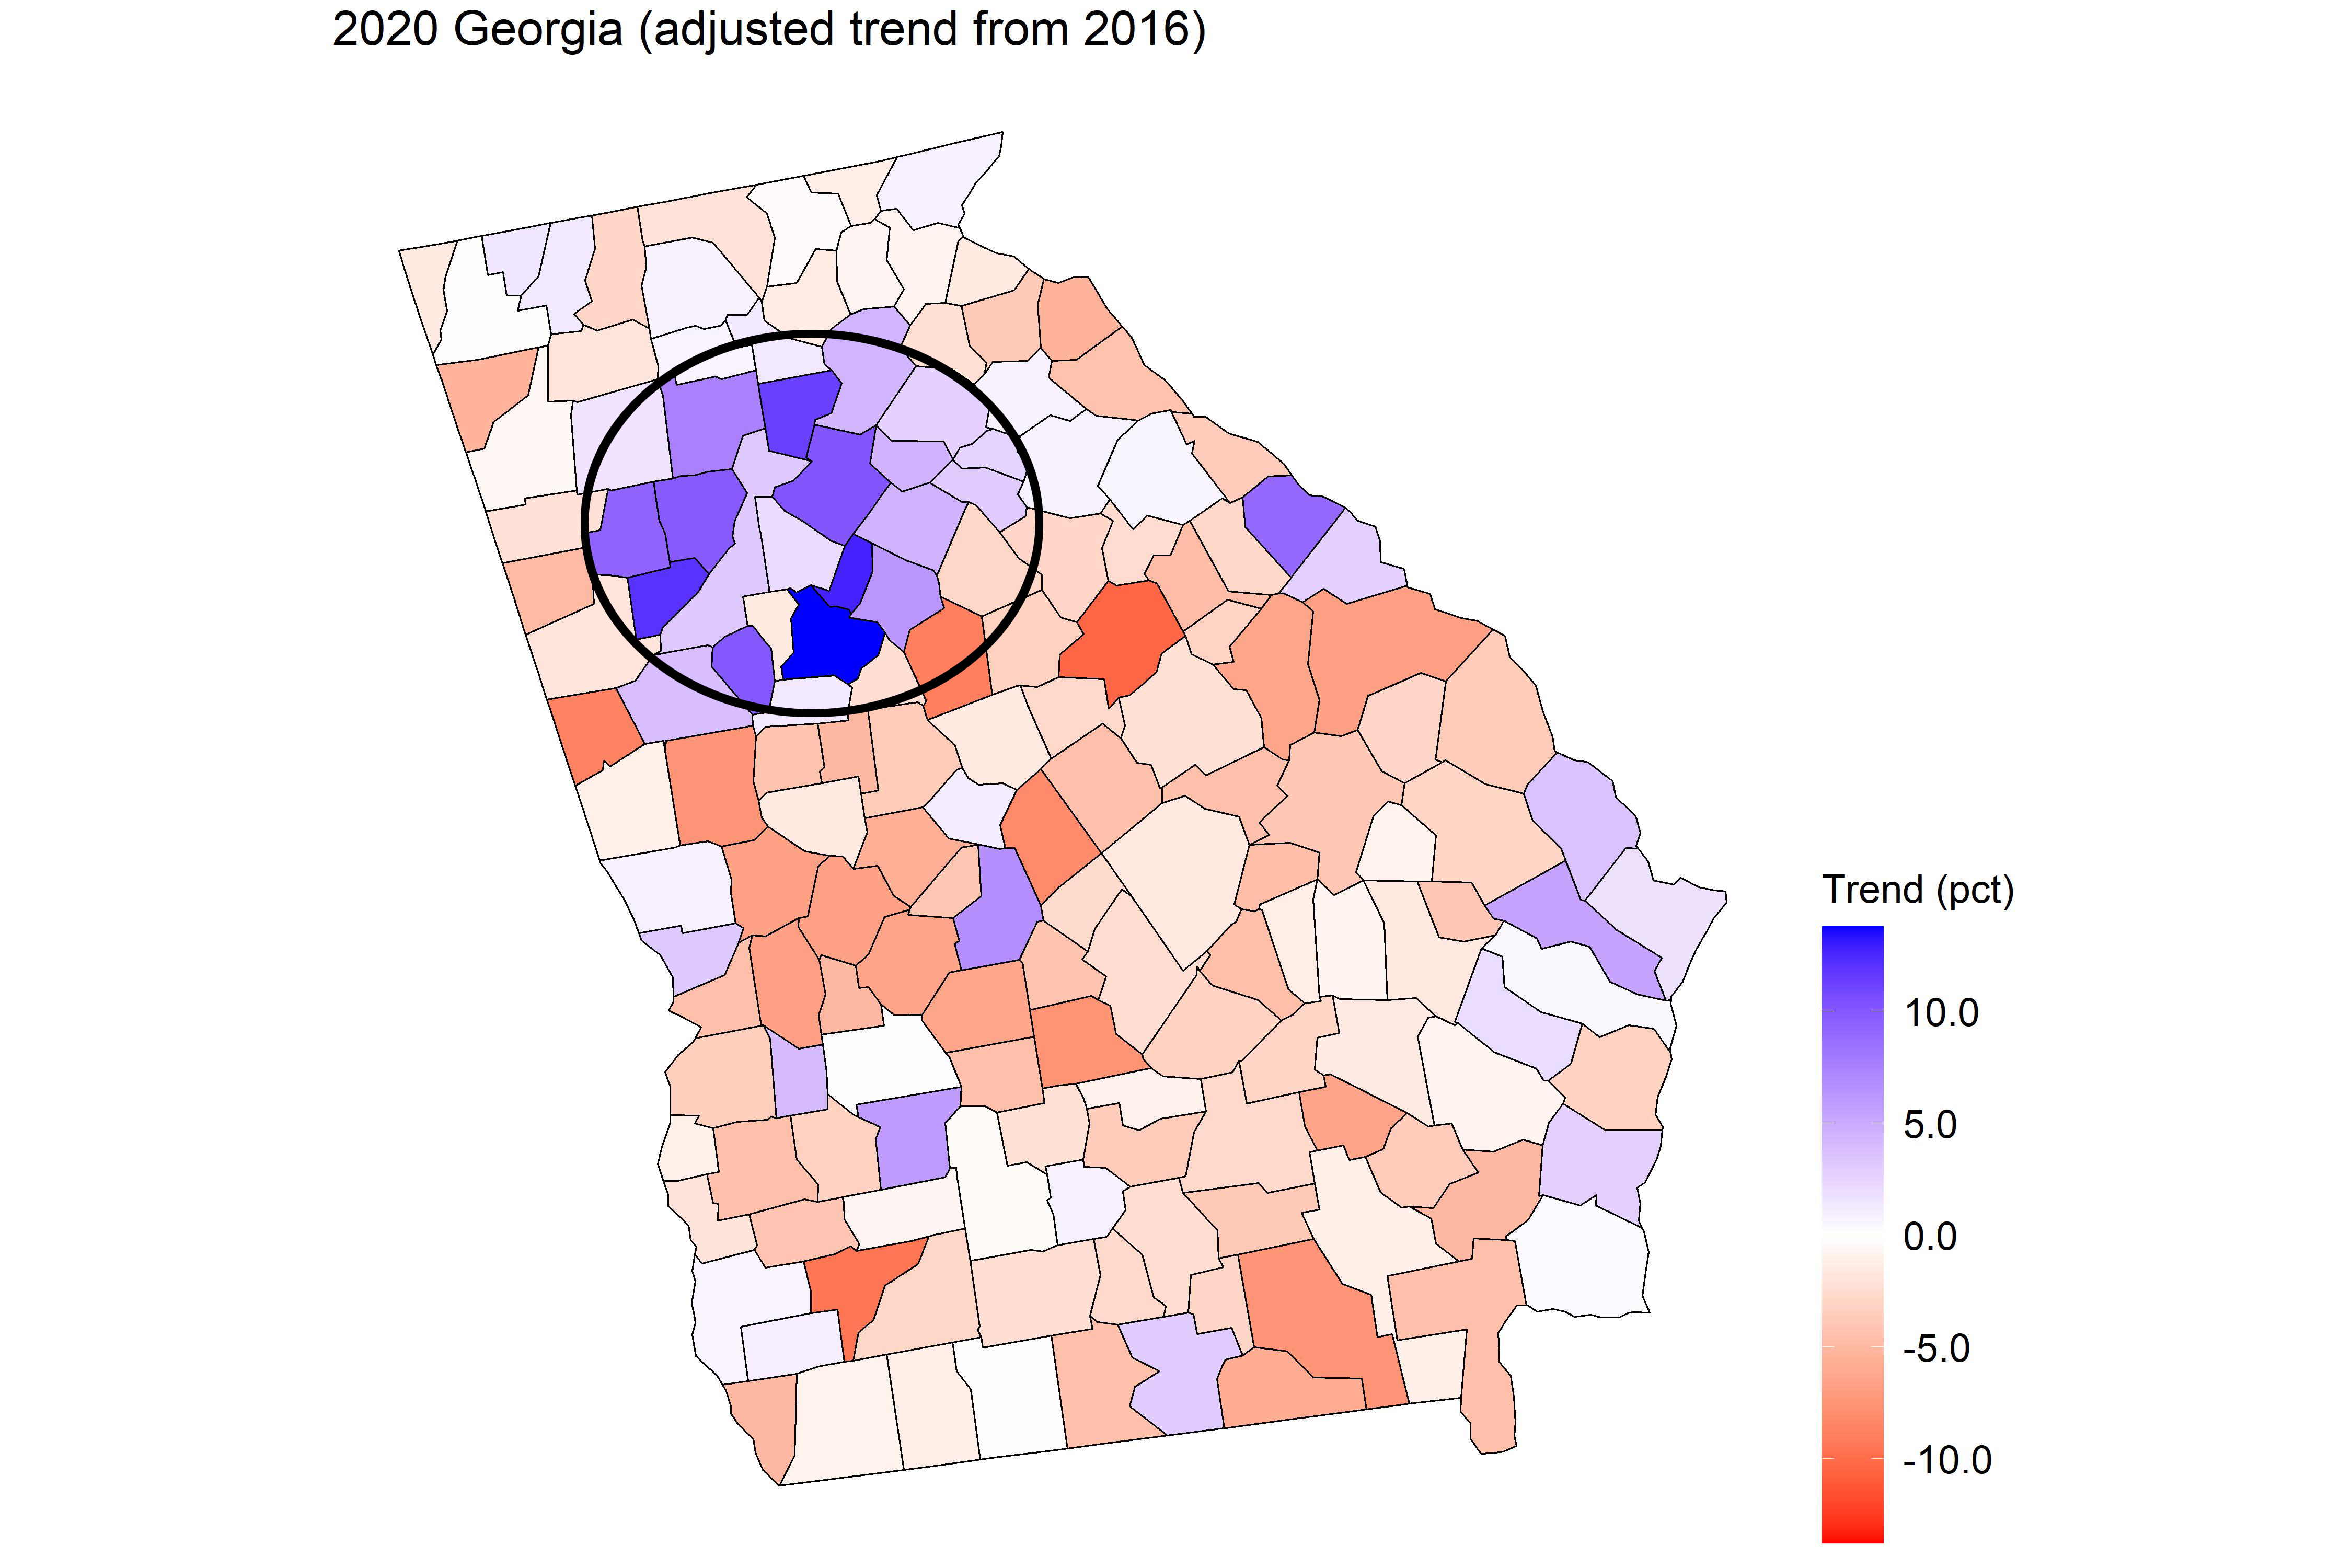
Two things to notice. First, the trends are much smaller than the R swings. Biden won not by making giant gains in a few areas, but consistent gains across the board. Second, look at all the Georgia counties in that list – that explains how Biden flipped the state. The counties around Atlanta swung consistently blue (but not so much the city itself, which as already heavily blue):

Like the Texas border counties, the swing was consistent across both traditionally blue and red counties. Everything in the greater Atlanta area swung blue, and it gave Biden the state.

One thought on “Interesting Trends”