I’ll continue my look at the IRS migration data; specifically, state-to-state migration. I’ve got data for the past 14 years, so let’s get digging. Here are the largest state-to-state migration totals for that period:
| From | To | Migration, 2008-2022 | Reverse Migration |
| California | Texas | 989,744 | 564,287 |
| New York | New Jersey | 859,094 | 496,497 |
| New York | Florida | 851,938 | 414,838 |
| California | Arizona | 635,432 | 402,452 |
| Florida | Georgia | 609,691 | 564,034 |
| California | Nevada | 604,838 | 356,971 |
| Texas | California | 564,287 | 989,744 |
| Georgia | Florida | 564,034 | 609,691 |
| Florida | Texas | 560,271 | 477,570 |
| California | Washington | 553,507 | 384,579 |
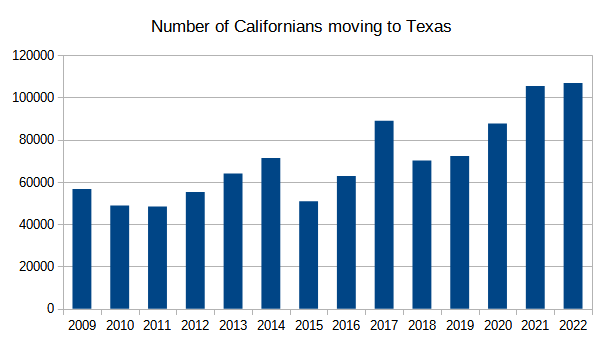
Over this 14 year period, nearly a million Californians moved to Texas (and a half a million made a move in the opposite direction). This is a well-discussed phenomenon – you’ve probably seen many reports about this migration. It’s been happening for years, but has accelerated the past few years:
You’ll notice that the “From” states all have large populations, and the “To” states generally do too. That’s because we’re just listing raw migration counts. Big states tend to have larger migration totals, simply because they have more people.
Knowing that, let’s adjust the migration numbers by the size of the state. We’ll calculate the largest state-to-state migrations, but this time as a percentage of the 2022 population of the “From” state. This basically answers the question, “which state had the highest percentage of its population move to another state?”
| From | To | Total Migration, 2008-2022 | % of “From” Population |
| District of Columbia | Maryland | 236,019 | 35.18% |
| District of Columbia | Virginia | 111,639 | 16.64% |
| North Dakota | Minnesota | 94,174 | 12.09% |
| Nevada | California | 356,971 | 11.23% |
| New Mexico | Texas | 208,493 | 9.86% |
| Rhode Island | Massachusetts | 102,434 | 9.36% |
| Hawaii | California | 132,581 | 9.21% |
| New Hampshire | Massachusetts | 125,116 | 8.94% |
| Kansas | Missouri | 258,620 | 8.81% |
| Wyoming | Colorado | 49,427 | 8.50% |
Washington, D.C. gets treated like a state for lots of statistical analysis, but it’s really just a city. And it’s a city with bedroom communities right next door in two states. So it kind of skews the list here. Still, it’s remarkable that over the course of 14 years, more than half of D.C. residents moved to either Maryland or Virginia.
The first real state on this list is North Dakota, which from 2008 to 2022 saw 12% of its population move to Minnesota (11% went in the other direction over the same period). The other pairs in this list generally follow a similar pattern – a smallish state losing a chunk of its population to a larger neighbor. Even the Hawaii -> California migration fits the pattern, sort of. Calling California “close” to Hawaii is a bit of a stretch; let’s just say it is its closest neighbor.
Let’s pivot that question a bit, and look at the largest migrations as a percentage of the destination state.
| From | To | Total Migration, 2008-2022 | % of “To” population |
| Maryland | District of Columbia | 176,166 | 26.26% |
| California | Nevada | 604,838 | 19.04% |
| Virginia | District of Columbia | 101,046 | 15.06% |
| Massachusetts | New Hampshire | 206,382 | 14.75% |
| Pennsylvania | Delaware | 114,868 | 11.27% |
| Minnesota | North Dakota | 86,279 | 11.08% |
| California | Idaho | 195,094 | 10.06% |
| Massachusetts | Rhode Island | 109,565 | 10.02% |
| California | Hawaii | 140,410 | 9.75% |
| California | Oregon | 402,225 | 9.49% |
This list contains many of the same pairs of states as the previous one. Not surprising – if there’s migration from A -> B, then there’s probably migration from B -> A. Note that California shows up four times on this list. As we discussed last time, it’s not that a huge number of Californians are fleeing. It’s just that the Golden State is so populous, its expats tend to dominate smaller neighbors. I’m sure that won’t stop people in Idaho and Oregon from complaining about how Californians have ruined the place.
At the other end of the spectrum, here are the smallest state-to-state migrations, again as a percentage of population of the “From” state:
| From | To | Total Migration, 2008-2022 | % of “From” Population |
| Wyoming | Rhode Island | 70 | 0.012% |
| South Dakota | Rhode Island | 115 | 0.013% |
| Mississippi | Vermont | 373 | 0.013% |
| New Jersey | Wyoming | 1380 | 0.015% |
| Arkansas | Vermont | 462 | 0.015% |
| Oklahoma | Vermont | 619 | 0.015% |
| Alabama | Vermont | 822 | 0.016% |
| Louisiana | Vermont | 779 | 0.017% |
| Massachusetts | North Dakota | 1212 | 0.017% |
| Rhode Island | Wyoming | 195 | 0.018% |
These are the rarest moves. What these pairs of states have in common is that they, well, don’t have anything in common. Eastern seaboard vs. western mountain. Deep South vs. Vermont. The states aren’t physically close, or culturally. So it’s not surprising that these are the most unlikely migrations.
Still, the numbers are pretty remarkable. Over those 18 years, an average of five people per year moved from Wyoming to Rhode Island. Over that same period, an average of six people per hour moved from California to Texas (!)