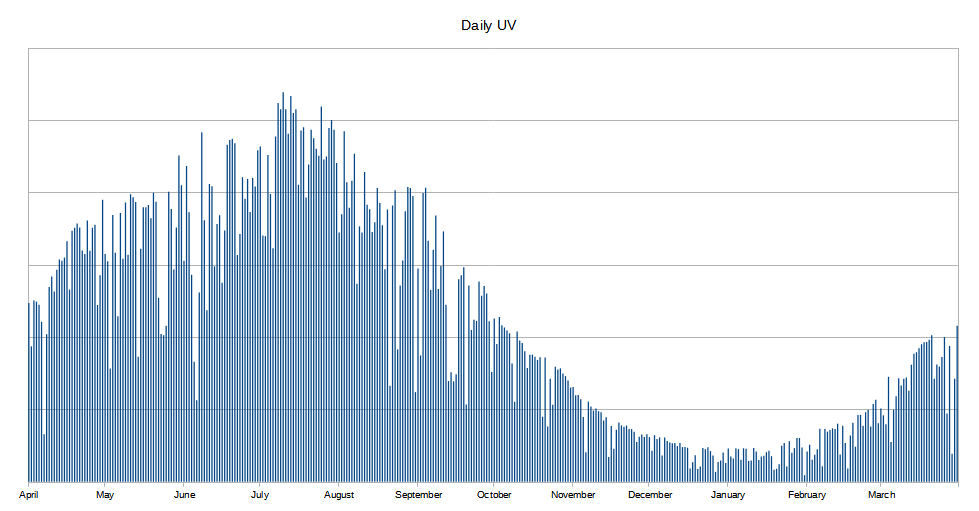
Here’s the last post regarding the year’s worth of weather data at our house. Today I’ll talk about sunshine. Specifically, UV index. The Tempest device reports the UV index each minute of the day. Here’s the cumulative UV total for each day of the year (April 2023 – March 2024):

The general shape of the curve matches seasonal changes. Obviously there’s more UV in summer, for two reasons: more daylight, and the sun is higher in the sky (low-angle sunshine filters UV through layers of the atmosphere). The ‘holes’ in the graph (or, “broken comb teeth”) represent days where there was significant cloud cover or fog. May Gray and June Gloom, indeed, but it happens all year.
It’s remarkable how little UV there is in winter, even during sunny days. The trough of that curve indicates that January gets about ten times less UV than July, even on cloudless days.
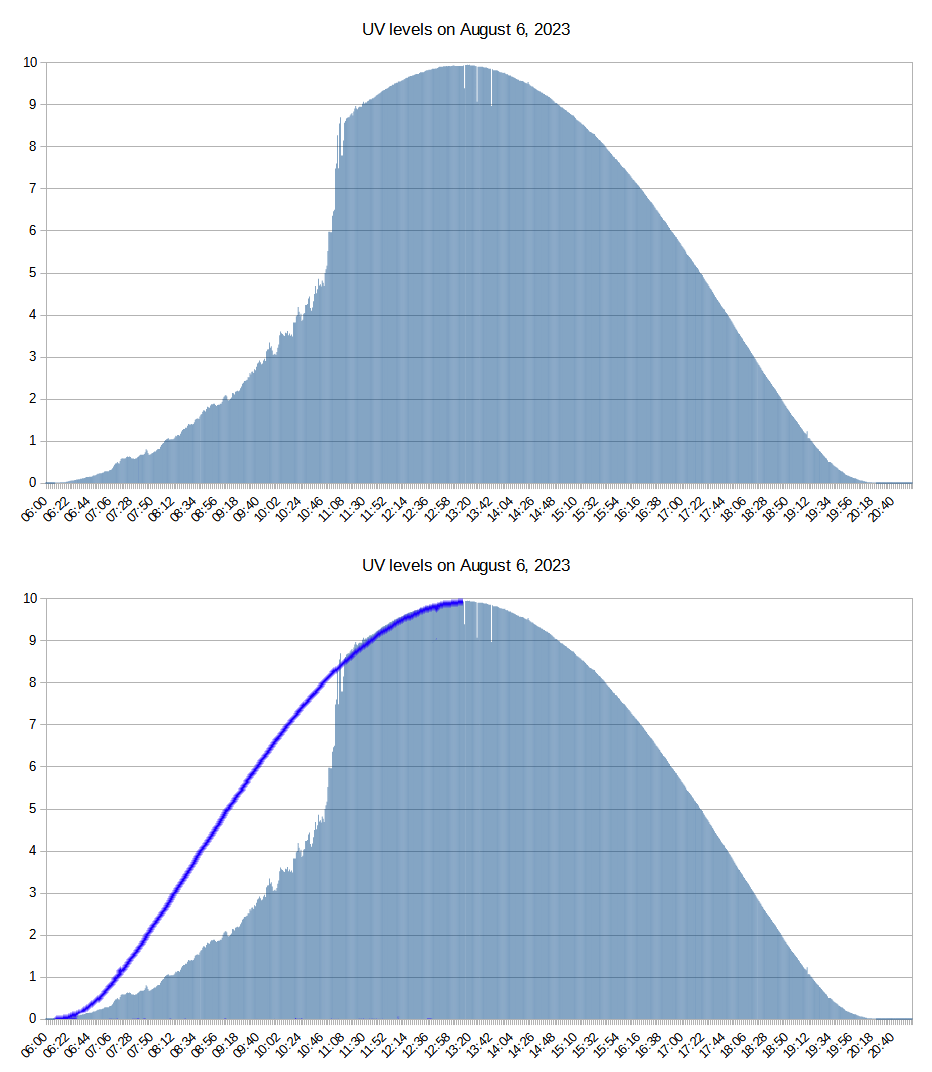
Here’s an example of how typical early morning clouds and fog affect the UV levels over the course of a day. The day in question is August 6, 2023. Here’s the UV level at each minute, from sunrise to sunset:

The morning was cloudy, limiting the amount of UV received. Starting around 11 AM, the clouds burned off, and the Tempest recorded maximum UV the rest of the day (a nice smooth curve). The dark blue line is a mirror of the afternoon curve: this represents the UV level that would have happened, if it wasn’t cloudy. All of the white space below the blue line is sunshine lost to the clouds. A very typical graph for this area – the price of living near the coast. No complaints here!
