The US Census reports on categories of bachelor’s degrees. Here are the total number of degrees for each category (adults 25 and older):
| Science and Engineering | |
| Computers, Mathematics and Statistics | 3,951,250 |
| Biological, Agricultural, and Environmental Sciences | 5,147,583 |
| Physical and Related Sciences | 2,560,403 |
| Psychology | 4,113,655 |
| Social Sciences | 6,616,450 |
| Engineering | 6,211,477 |
| Multidisciplinary Studies | 706,006 |
| Science and Engineering Related Fields | 7,946,691 |
| Business | 16,014,419 |
| Education | 9,196,618 |
| Arts, Humanities, and Other | |
| Literature and Languages | 3,639,258 |
| Liberal Arts and History | 4,023,390 |
| Visual and Performing Arts | 3,470,871 |
| Communications | 3,363,235 |
| Other | 4,864,197 |
How does the distribution of these degree types look if we break it down by state? Which categories are popular in which states? The measurement I’ll use is based on the population of adults who have a bachelor’s degree. I calculate the relative popularity of a degree, compared to the others. In other words, “of all of the people in the state who have a degree, what percentage have this particular one”
Let’s start with the first category, Computers, Mathematics and Statistics
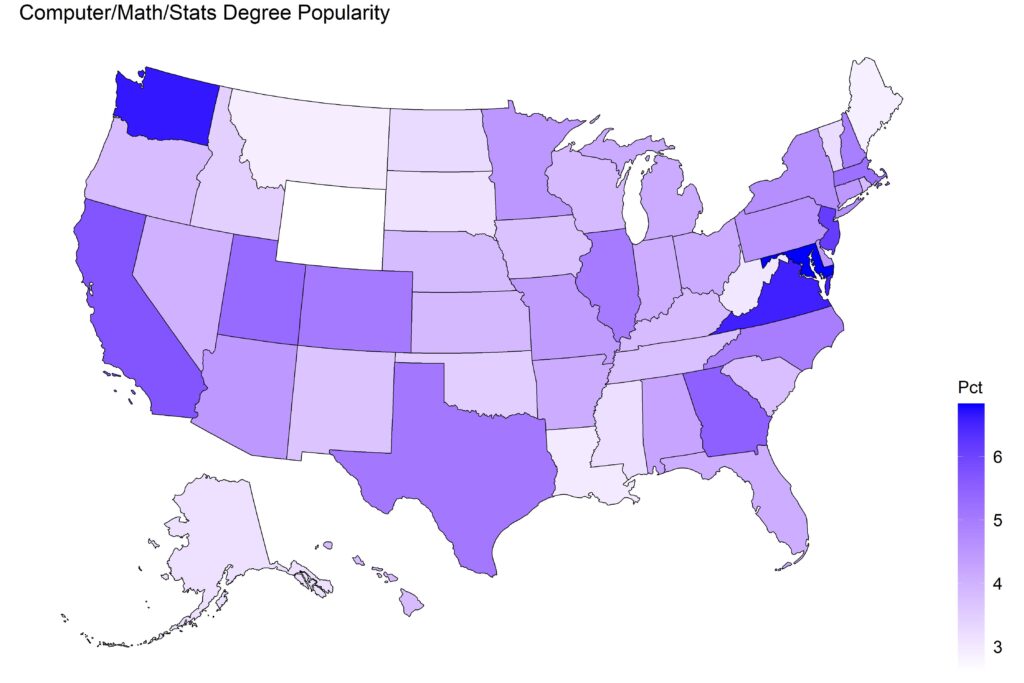
Washington state = Amazon, Microsoft, etc. (Of course, not just those companies but all of the other businesses that grew out of that environment). And the blue in Virginia and Maryland is likely DOD and other government workers who live near (but not in) D.C. Let’s check that theory with a county-level map of Virginia, Maryland, and Washington D.C.:
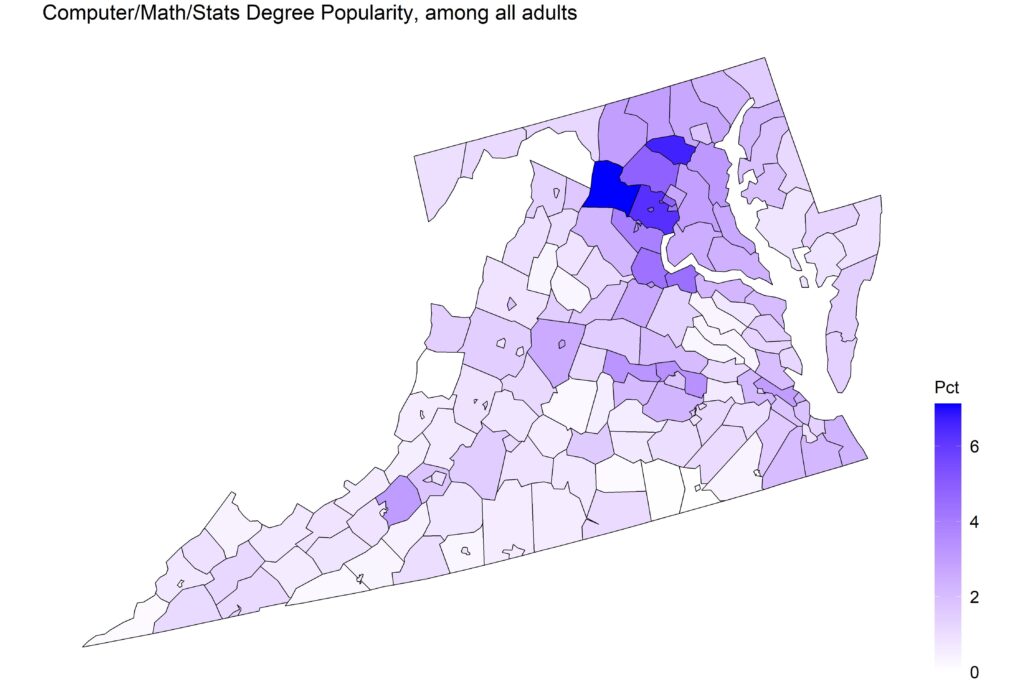
Yep, all centered around D.C.1For the county-level chart, I switched to popularity among all adults, as opposed to those with degrees. This is done to avoid spurious results in low-population counties.
Next let’s look at Biological, Agricultural, and Environmental Sciences degrees:
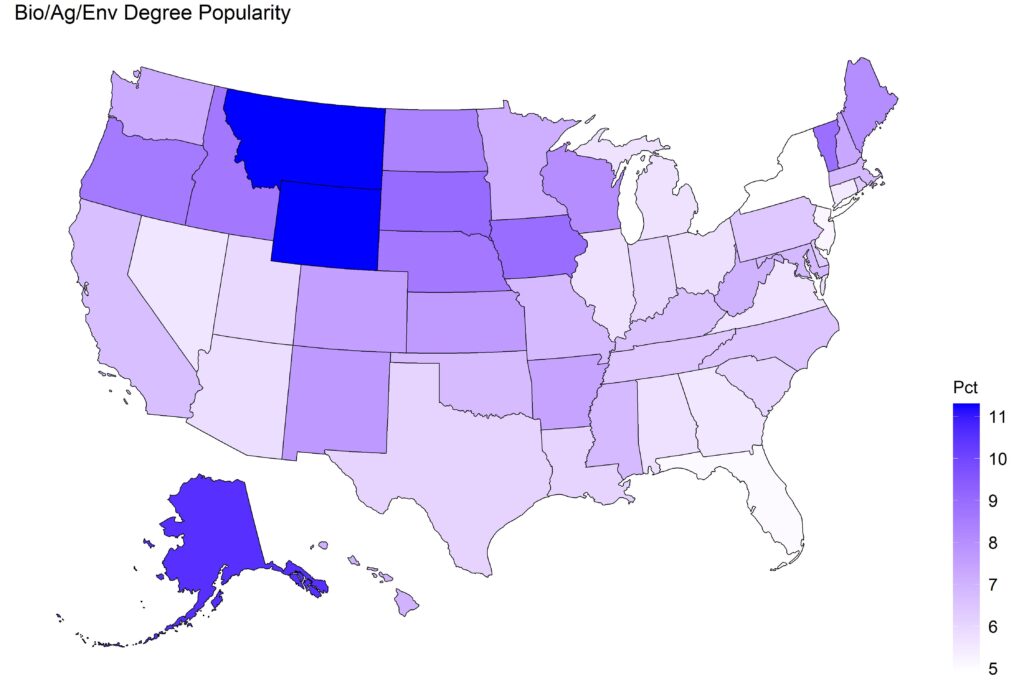
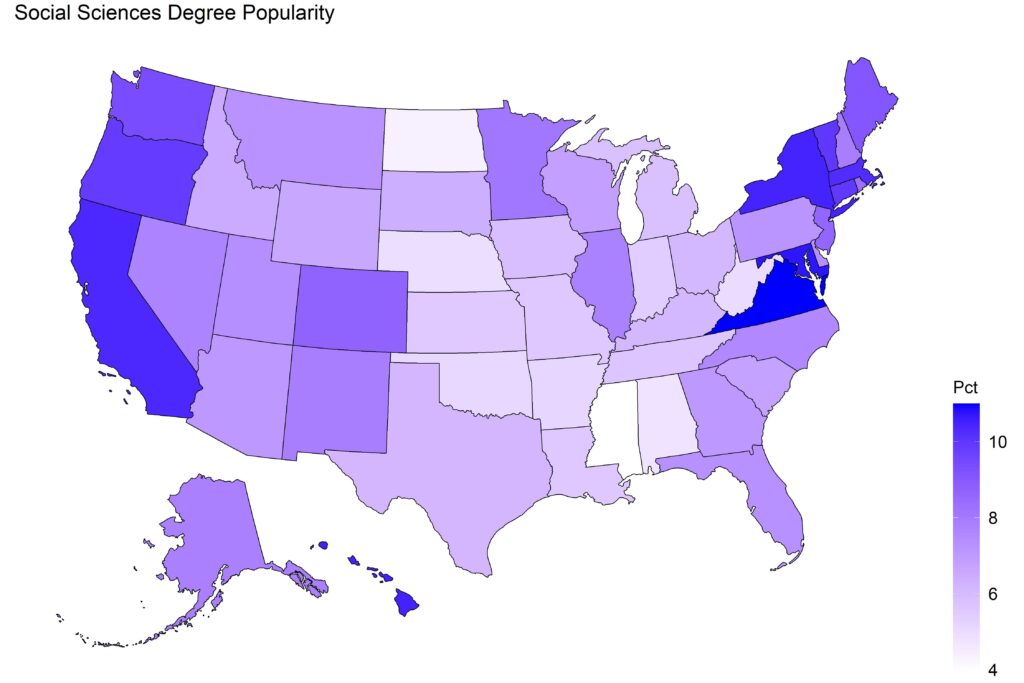
No shockers here when you think about it: big agricultural and forestry states. Skipping ahead a bit, Social Science fields are definitely a coastal thing:
Engineering degrees are heavily concentrated in four states:
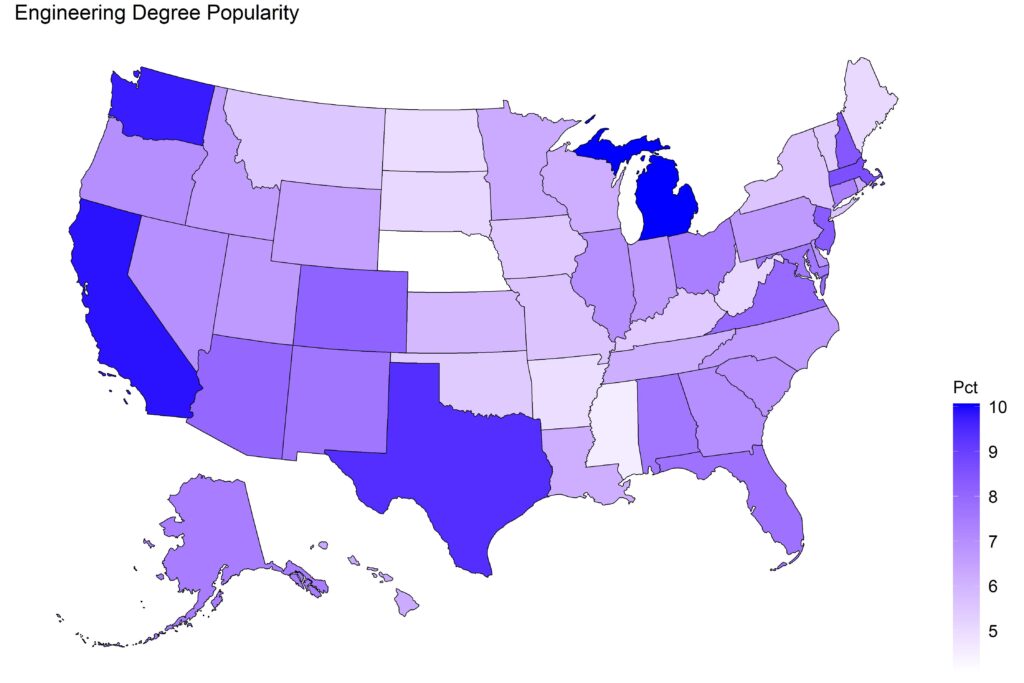
Here’s a simplistic, first-level set of guesses. Washington = Boeing. Michigan = automobiles. California = computers. Texas = NASA. I’m especially not too sure about those last two; California and Texas are big states with lots of industries, so no doubt it’s more than just that.
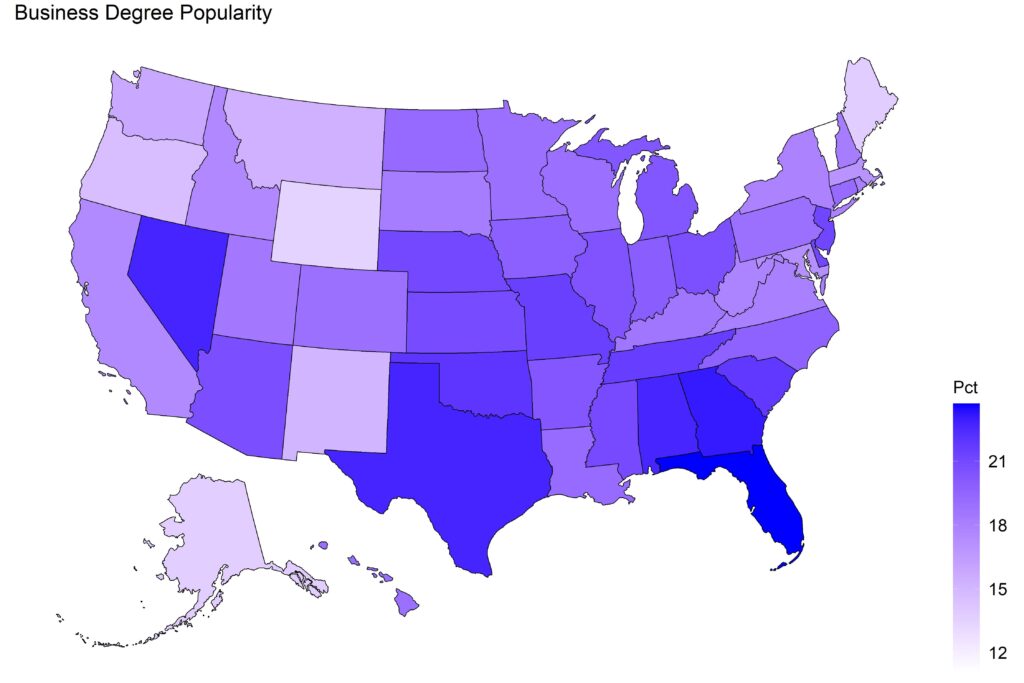
Business degrees are popular in states with growing populations:
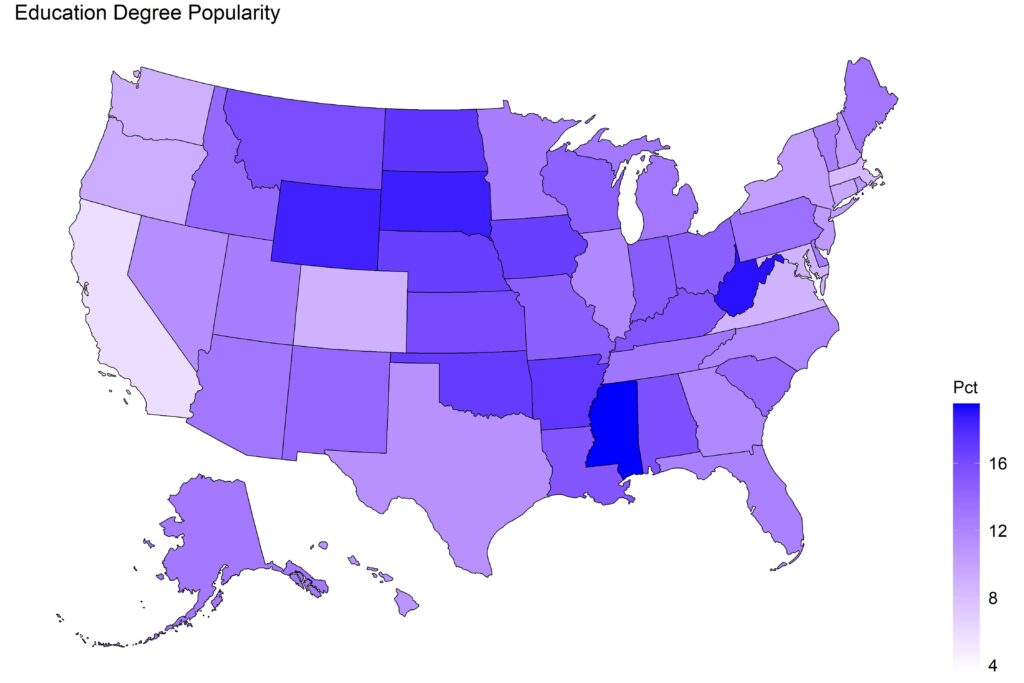
Education degrees are concentrated in rural states:
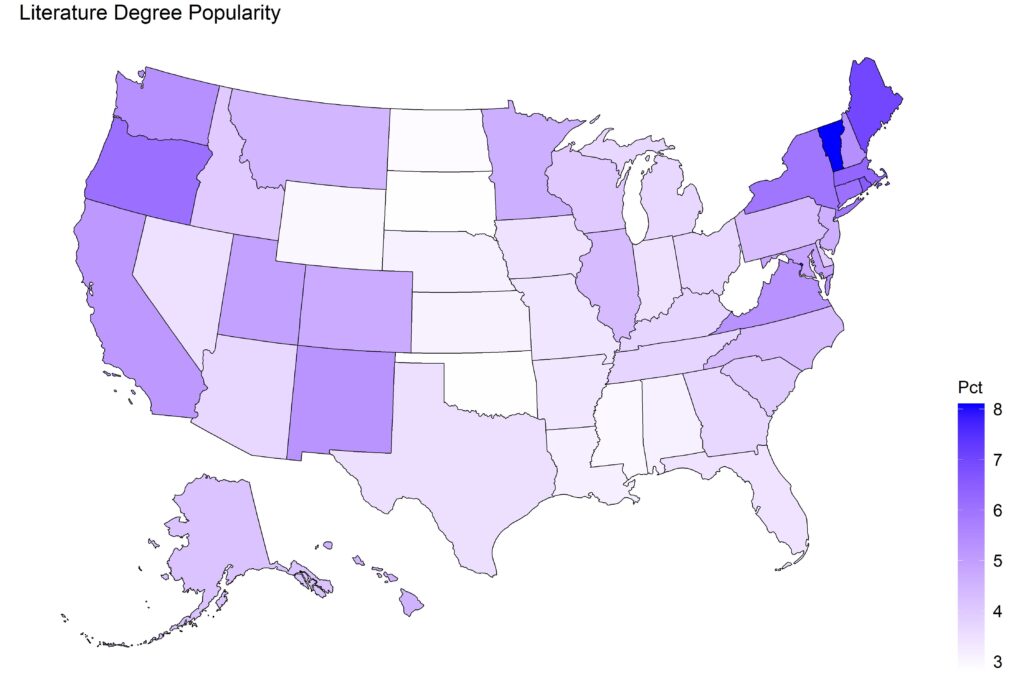
There’s something about Vermont and Literature degrees, don’t ask me what:
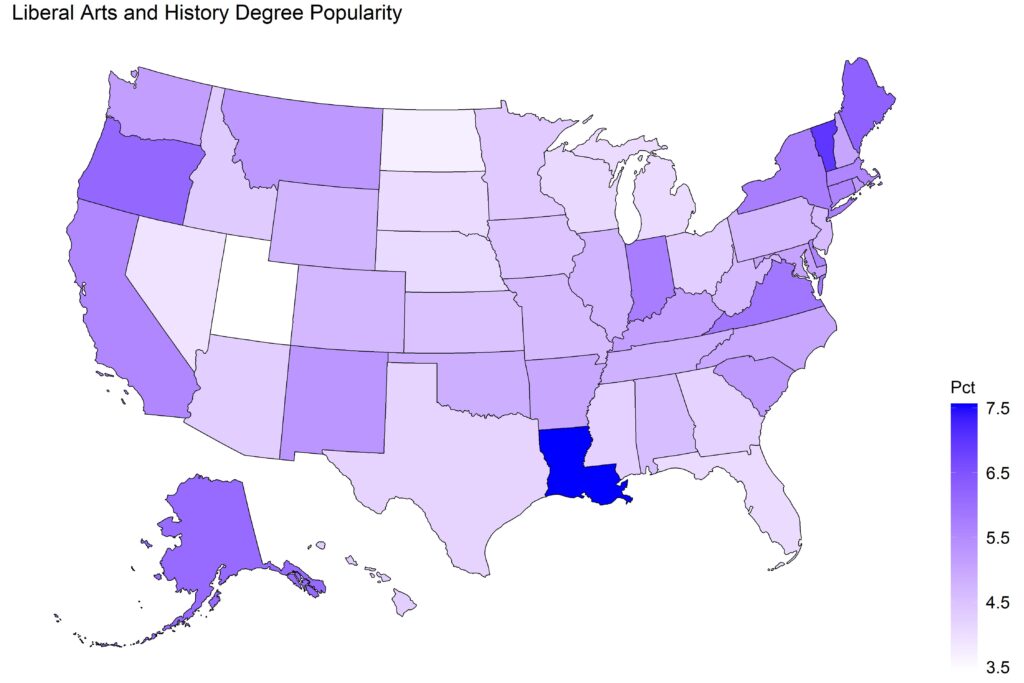
Same is true for Louisiana and the Liberal Arts and History fields:
Finally, you remember I talked about the two ‘grab bag’ categories, that contained a weird mix of degrees that didn’t fit into the standard categories? North Dakotans love ’em:
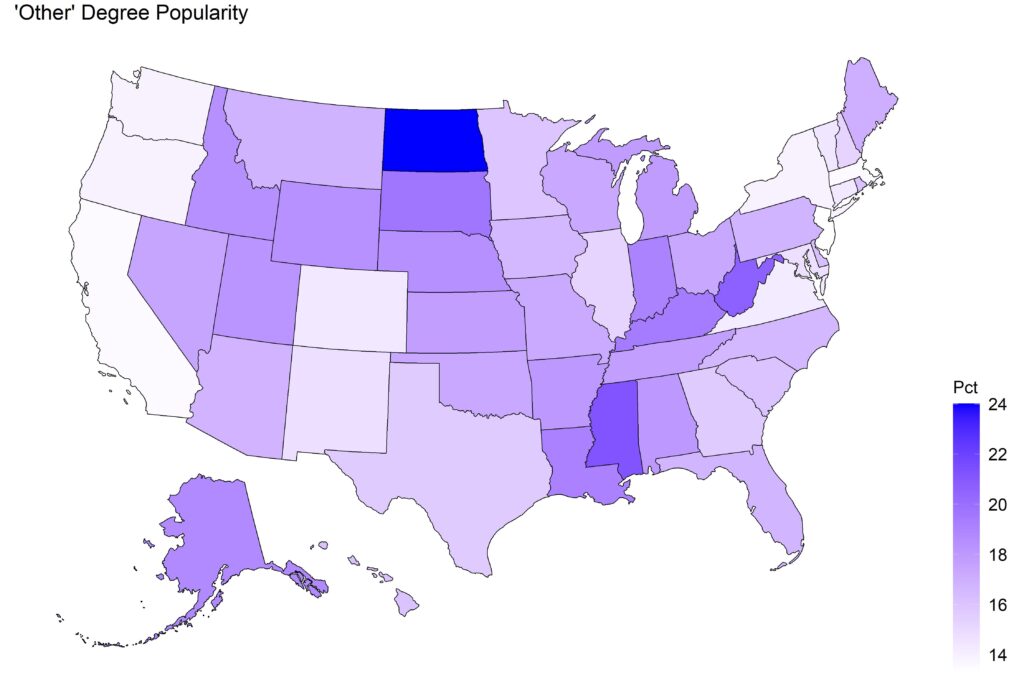
What’s up with that? Since the census reports don’t break down the degree types any further, there’s no way to really determine what’s going on. One thing I noticed is that there is a clear inverse correlation between the degree frequency of a state (percentage of adults who have a degree) and the “Other” degree population. That is, the more highly educated a state is, the lower the percentage of Other degrees. Here’s a graph:
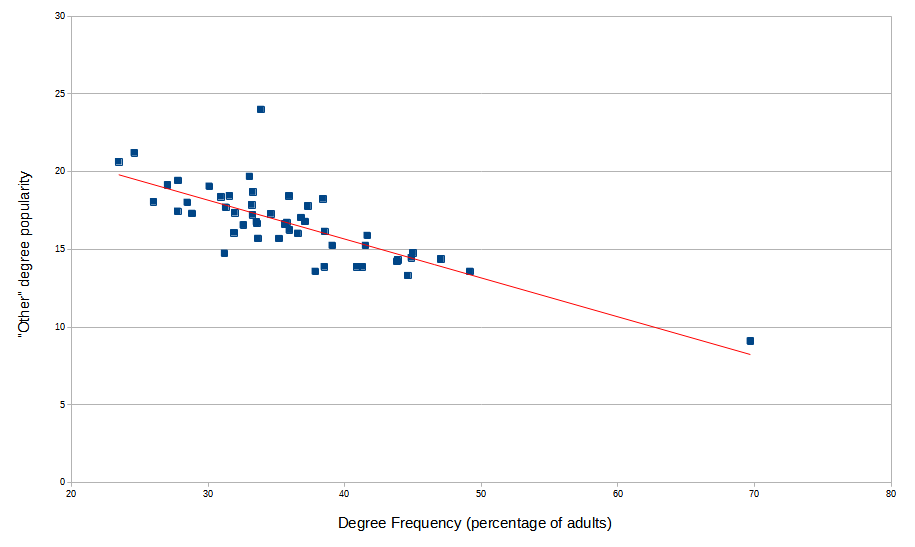
Now, on the surface there’s nothing wrong with the ‘other’ degrees; in fact, some are in fast-growing fields in high demand. But something about them is attractive to people in states that don’t get as many degrees (or, are unattractive to high-degree states).
Does that explain North Dakota? Maybe partially, but not really. See that blue dot that stands above all the rest? That’s North Dakota. It’s definitely an outlier. Another mystery that may never be solved.
