So far my posts regarding the American Time Use Survey have mostly looked at the data from 2003 to 2023 as a whole, summing up twenty years worth of results to analyze how Americans spend their time. But for certain activities the data has changed over the past two decades – we either spend more or less time now versus 2003 performing those tasks. Today I’ll look at these activities.
When I first considered this, smart phone usage came to mind as something that has changed considerably in the past twenty years. These devices didn’t exist in 2003 – now for many people they consume 3-4 hours of their time daily. But the ATUS doesn’t effectively capture this. There is no “smart phone” activity in the ATUS; in fact, the ATUS is not a good source of information about how much time people spend online in general. To quote from the Bureau of Labor Statistics:
Activities are coded based on how survey respondents were using the Internet, not whether they were using this tool. For example, if a respondent reports “ordering groceries online,” this activity would be assigned the activity code for “grocery shopping.” If a respondent reports “updating my blog,” the activity would be coded as “writing for personal interest.” The category “computer use for leisure (excluding games)” includes some Internet use, but it is not comprehensive and it also includes non-Internet-based activities.
So the ATUS is not going to tell us much about smart phone usage. But we’ll see some of this activity show up in other categories.
In no particular order, here are the activities where the time spent has significantly changed over the past twenty years. The Y axis is the average minutes per day Americans spend doing this activity. This includes people who didn’t do that activity, which is why the numbers might seem low for some categories.
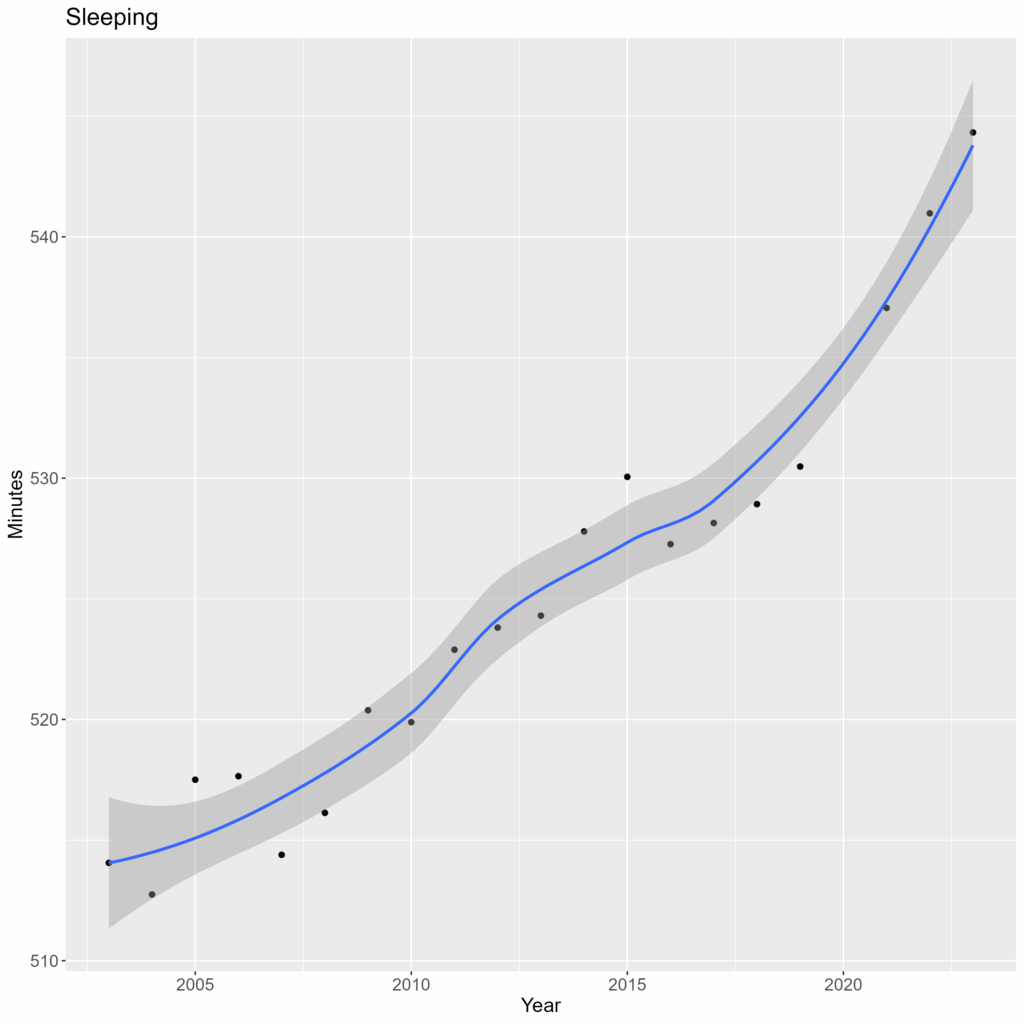
Americans report sleeping 30 minutes more these days, compared to the early 2000s. At first blush this would seem to be a good thing? It was already a trend, but it appears to have accelerated with the pandemic.
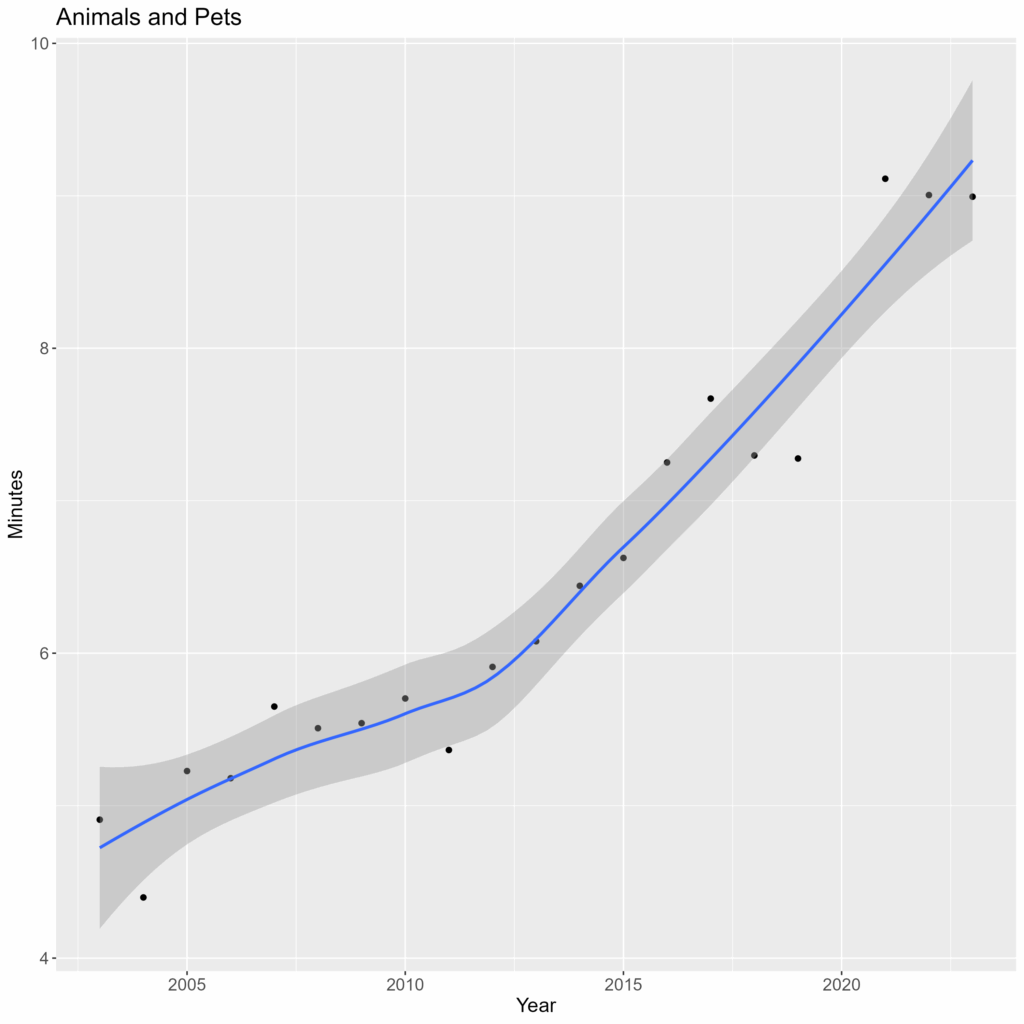
As a nation, we’re spending almost twice as much time on our pets now as opposed to twenty years ago. Is this because more of us have pets, or that those who have them are spending more time with them? Both, as it turns out: there was a 50% increase in the number of people who reported pet-related activities, and a 27% increase in the length of these activities.
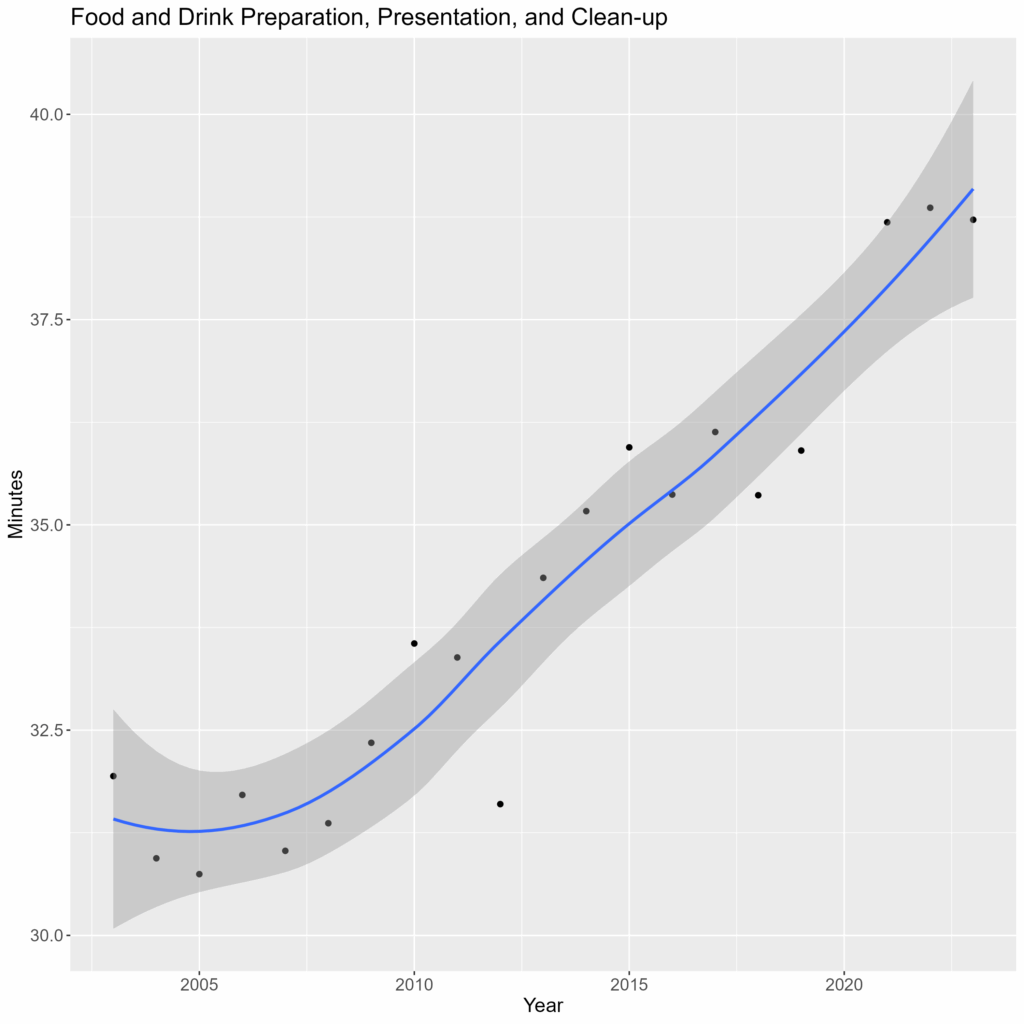
This activity sums up the process of cooking a meal at home (mostly, prep and clean-up, but not including grocery shopping). The plot was flat until the Great Recession (2008), then started upward as people cooked at home rather than eating out (presumably to save money?).
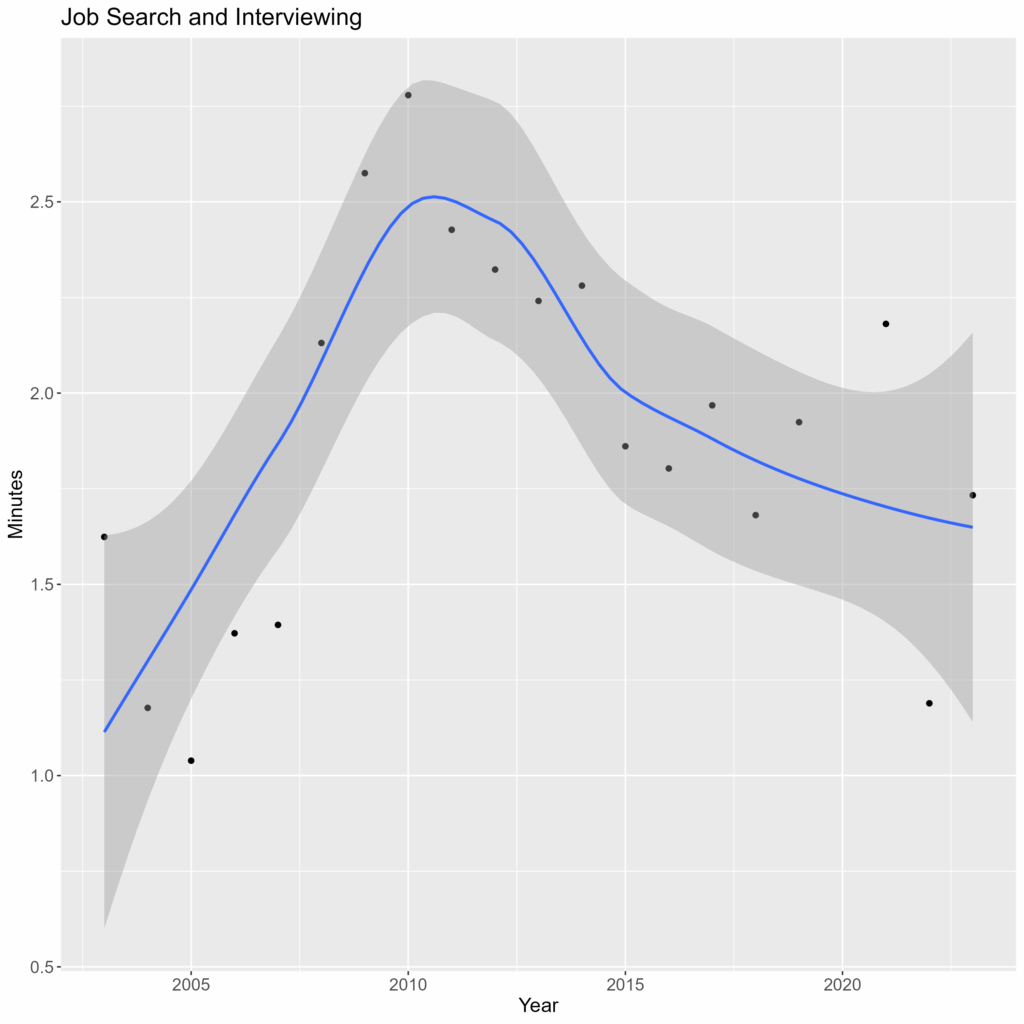
It’s no surprise that this graph pretty much exactly matches the plot of the unemployment rate. The more people who are unemployed, the more time is spent looking for work.
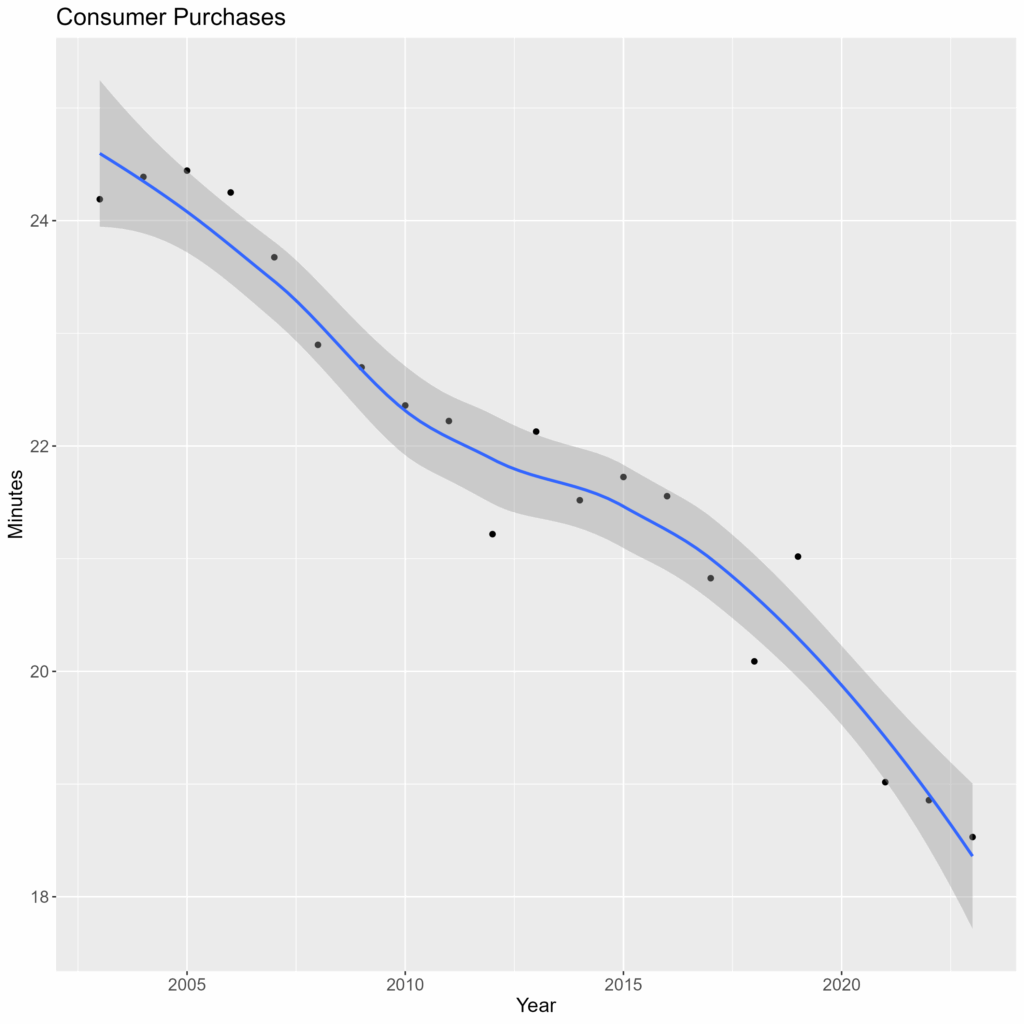
We spend less time shopping these days. It’s got to be because of the internet – instead of going to a physical store, we buy things online.
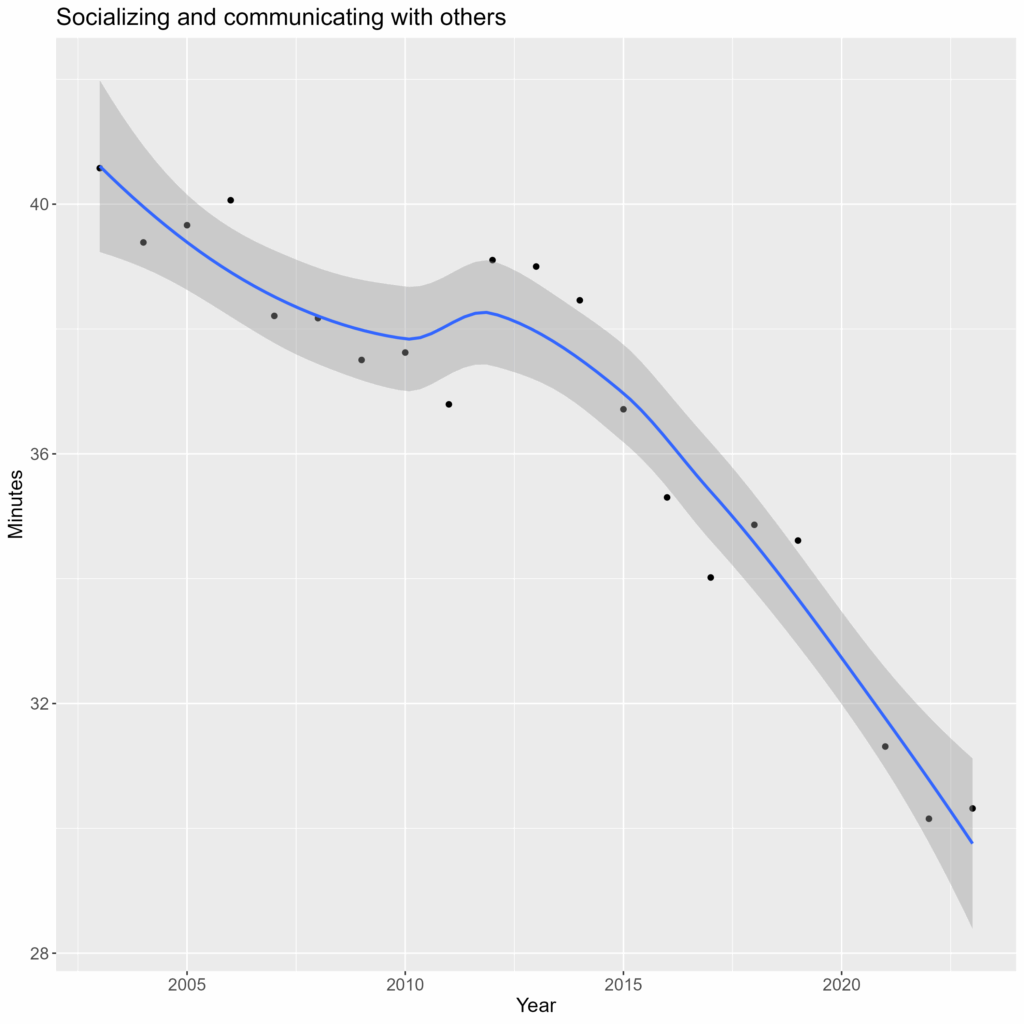
Socialization was already trending down, but it accelerated after Covid.
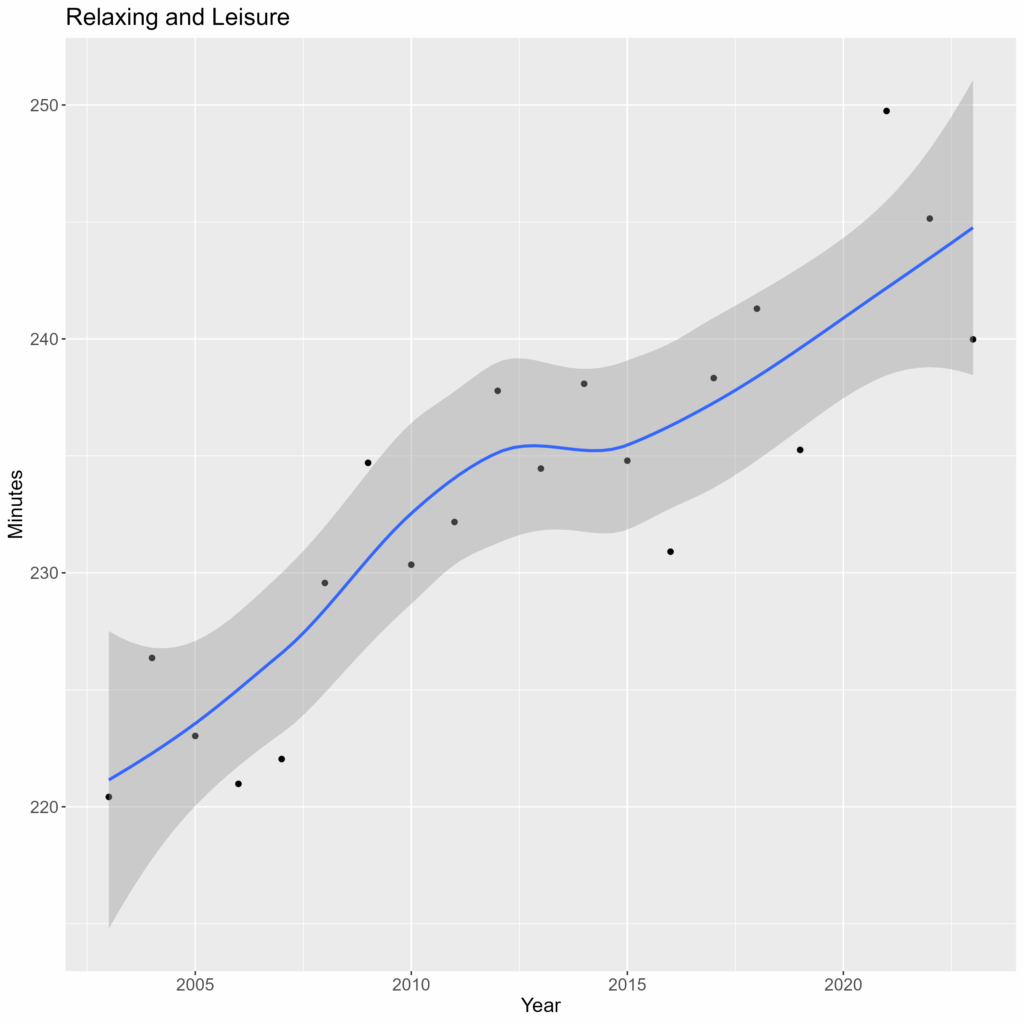
Two sides of the same coin. The previous chart shows a decrease of 10 minutes a day socializing. This one shows 20 more minutes Relaxing and Leisure, which are generally solitary activities. This includes playing games:
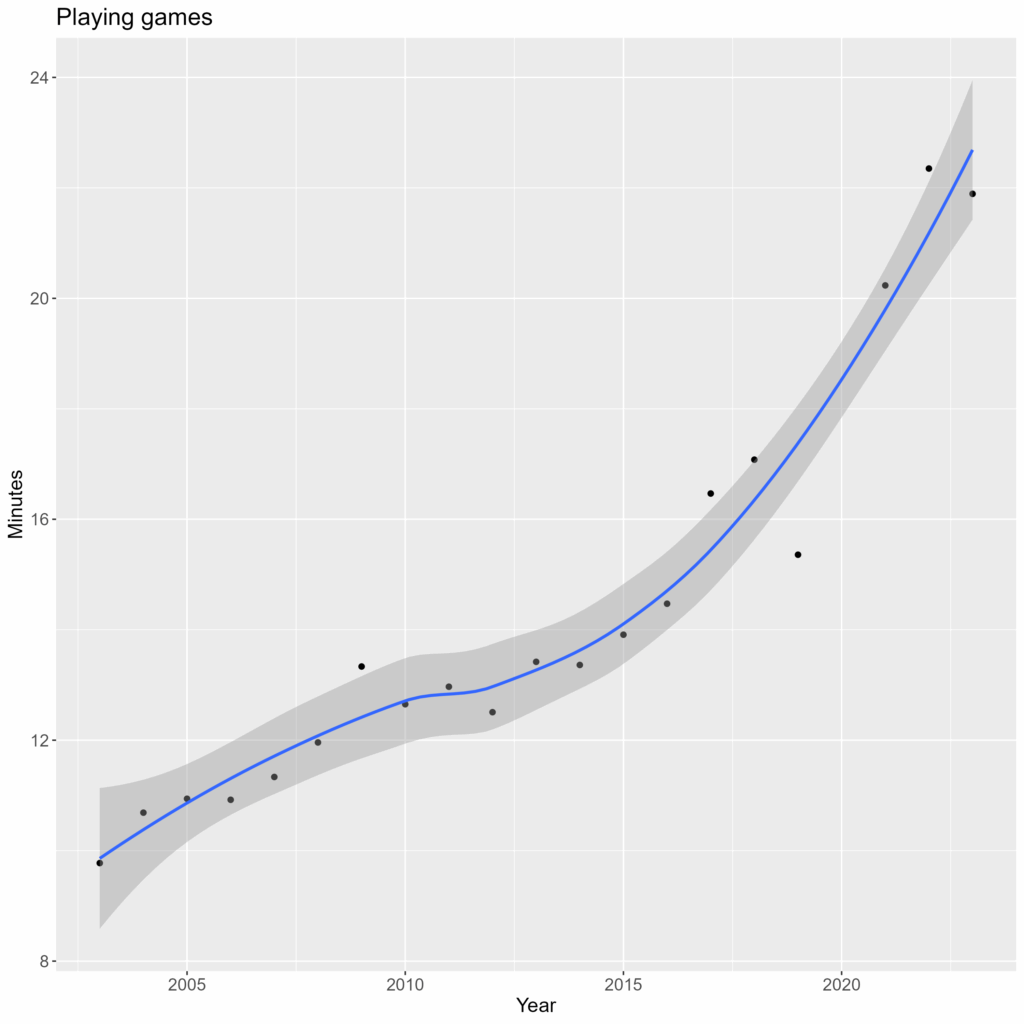
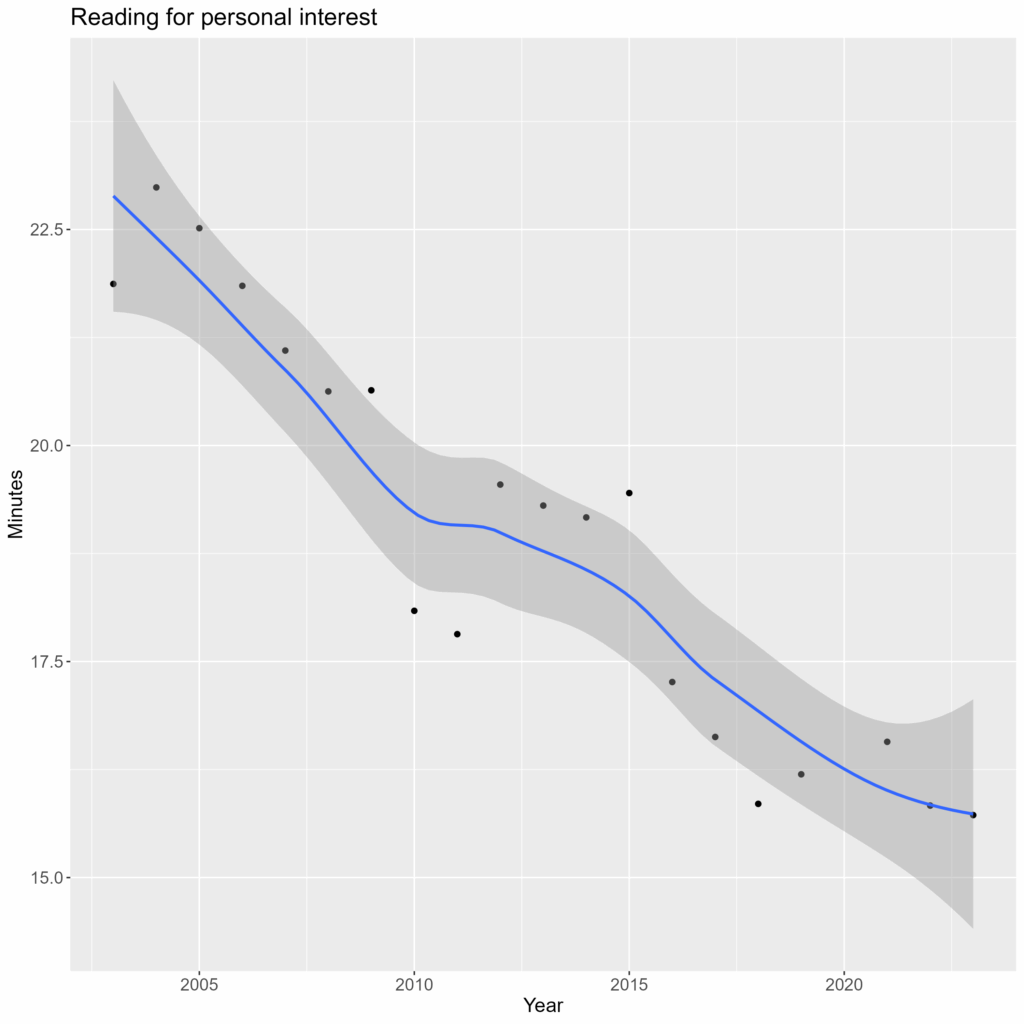
No doubt much of this on smart phones. On the other hand, people are reading less
Finally, participation in religion has been dropping:
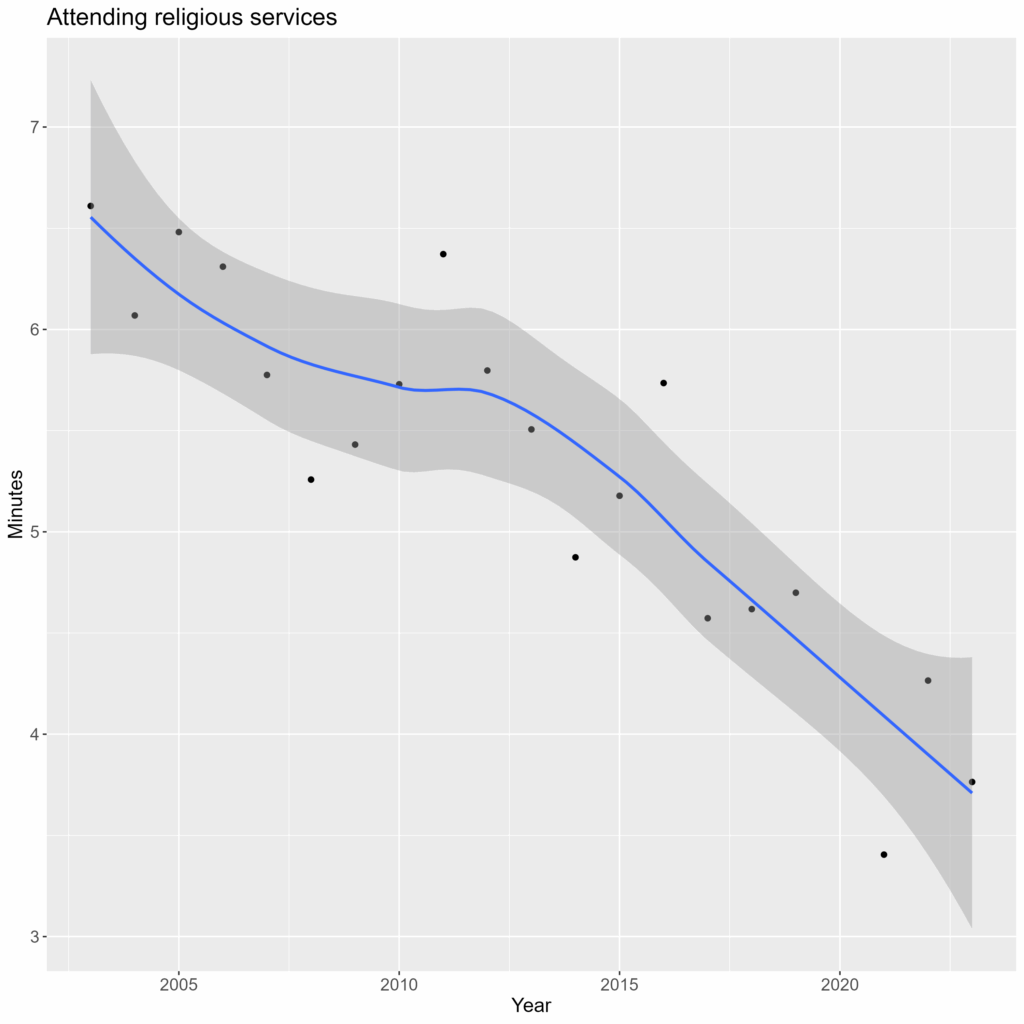
People who go to religious services still spend approximately the same time doing it (about two hours). They just aren’t going as often.
Interestingly, you would think that asking people about their religious practice would run into the social desirability bias problem, where people give answers they think they should (similar to the reading-to-children issue I discussed previously). But if you take the results from this study and convert them to an average frequency of attendance, the numbers pretty much match the results from ATUS. It looks like people don’t exaggerate their religious service participation. Maybe they think that Someone is looking over their shoulder when they answer….