Today I’m going to combine two data sets that I’ve worked with before. One is the Microsoft building database (yep, I just can’t quit it!). The other is the US Census housing data, at the census tract1A census tract is a small, usually permanent geographical division. Typically their population ranges between 1,200 and 8,000, with an optimum size of 4,000. There are about 73,000 census tracts in the United States level. Merging these two data sets provides a look at the different ways we’ve built up this vast county, and especially the very different ways we’ve made our homes.
As usual for these map-based posts, the bigger your screen, the better.
Let’s look at the extremes, because that’s always fun. We’ll start with the census tract that is most covered in buildings. Not surprisingly, it’s in Manhattan:
(The green lines are the boundary of the census tract. The red lines define each building in the tract. Because there are no gaps between buildings, a single block will often show up as one contiguous building.)
This tract is 68.2% buildings. Looks like the rest is streets and sidewalks. I’m sure it’s an exciting place to live, but you’re going to have to like concrete and asphalt:
At the other end of the spectrum, there are some huge census tracts in Alaska with almost no buildings (again, no surprise). The Microsoft building data for Alaska is hit-or-miss, but even tracts in the more “crowded” parts of the state are amazingly void of buildings. In the 6500 square miles of tract 3 of the Hoonah-Angoon Census Area , there are 61 buildings whose combined footprints cover about 1.5 acres (.00004% of the land).
Next we’ll look at density. Not the typical way that density is defined, which is population per land area. Instead, we’ll look at population per building footprint area. New York again leads the way, with some towers that pack in lots of people on a small footprint. The tract that tops the list, on the western edge of the Bronx, comes in at 1 person per 24.9 square feet:
Remember, that density is based on the building footprint. The towers are 40 stories tall, so the effective livable density (i.e., people per square foot of floor space) is substantially higher. But still, that’s a lot of people on a very small footprint.
In second place is another set of towers in New York, Brooklyn this time, at 1 person 27.9 square feetprint2square feet of a footprint:
Over 80% of this tract is greenbelt, so at least there’s a little space between each tower. But that’s still a lot of people in a small area.
What about the other end of the spectrum, places with low density (population per building area). Technically, it’s this place in Orange County, California, an industrial zone with only 4 people living there. Low population, lots of buildings:
But that seems kind of klugy. It’s not like those 4 people are living in gigantic mansions; it’s just that most of the buildings in that tract are industrial, not living quarters. The Microsoft database just identifies buildings, not homes. We’ll address this in a future post.
Finally, what about the sheer number of buildings in a tract? Tracts that are packed with lots of individual buildings, regardless of size? As measured in number of buildings per acre, this neighborhood in Chicago is the winner, at 13.4:
That’s a lotta buildings! The street view below shows a nice looking neighborhood, but the homes are small and packed in very close:
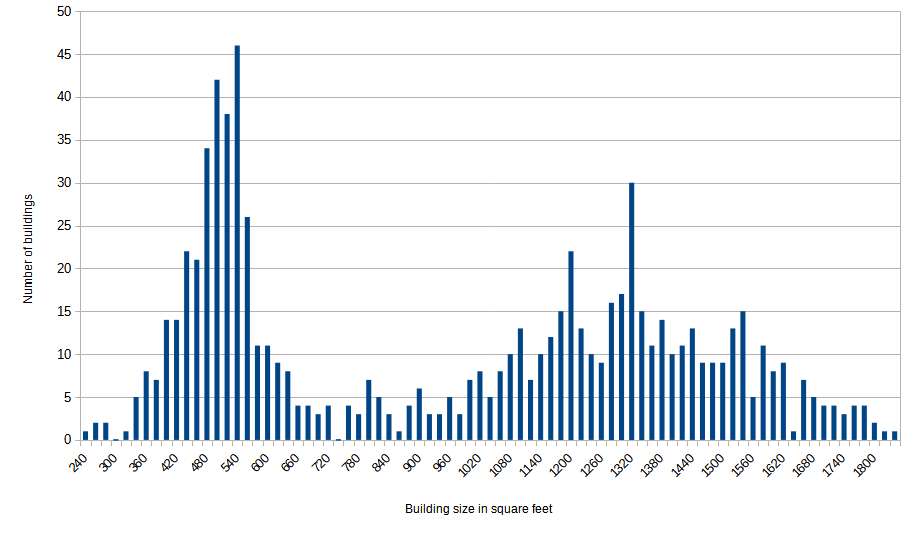
Still, the front and back yards provide a bit of space, and the buildings only consume 37% of the land (a far cry from the 60+% that you typically see in inner cities). Chicago is filled with neighborhoods like this, in fact, of the top 50 census tracts ranked by buildings per acre, 49 of them are in Chicago! There is a certain housing style associated with the Windy City: small footprints, packed close together, and with detached garages on the back alley. The detached garages basically double the number of buildings, since each one shows up separately (you can see this in the top-down view of the tract). Here’s a histogram of this census tract, showing the distribution of building footprints:

So, what about the one exception, the one census tract in the top 50 that was not in Chicago? Welcome to Balboa Island, in Newport Beach, California:
Choc-a-bloc full of 2-story houses; looks like about six feet of separation from your neighbor’s house. Whew!
As for the tracts with the fewest buildings per acre, usually they are gigantic tracts in the middle of low-population states. Like this tract in Nevada, which has 1 building per 0.0004 acres (33,0000 times less dense then the Chicago neighborhood)
But is that really true? As you can see, the tract is mostly empty land, with the occasional clump of buildings that make up a town. It’s not like the buildings in this tract are equally spread out over the entire area – for all we know, the houses in those red clumps might be as packed in as anywhere else. Wouldn’t it be nice if there was a way to quantify this “clumpiness”, and determine how close each house is to its neighbors? Stay tuned…

Quite interesting, and a reminder of how data can be deceptive at first.
We were recently in Whittier, Alaska. Population approximately 300, and almost all live in one condo building called Begich Towers.