
The 2025 American Community Survey has been released, and it contains some new questions regarding electric vehicles. We now know that 5.5% of US households have EVs. The ACS data breaks it down by state; here are the top five:
| State | Percentage of households with EVs see note |
| California | 15.0 |
| Washington | 9.6 |
| Hawaii | 9.1 |
| District of Columbia | 9.0 |
| Nevada | 8.8 |
[Note: There are two different calculations you can make with the Census data:
- Of all households, the percentage with an EV.
- Of households that have a vehicle, the percentage with an EV.
The later excludes households that don’t have a motor vehicle at all. I think #2 better reflects EV acceptance levels, since it asks “of those people who have cars, what percentage have EVs”. #1 will never reach 100%, since a certain percentage of households don’t have cars at all. I use #2 throughout this post.
Also, the Census defines vehicles here as “passenger cars, vans, and pickup or panel trucks of one-ton capacity or less kept at home and available for the use of household members.” So, no motorcycles, mopeds, e-bikes.]
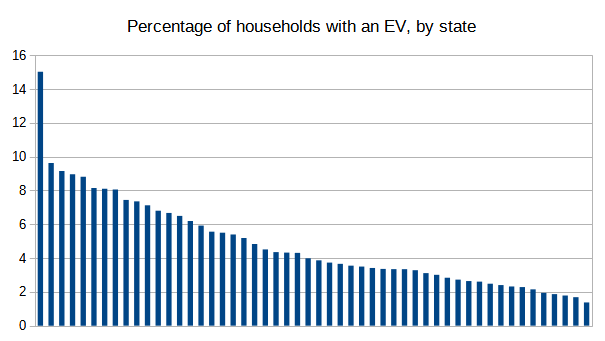
When it comes to EVs, it’s California, then everyone else. If you plot the state EV percentage from highest to lowest, it’s pretty close to a straight line, except for the Golden State:
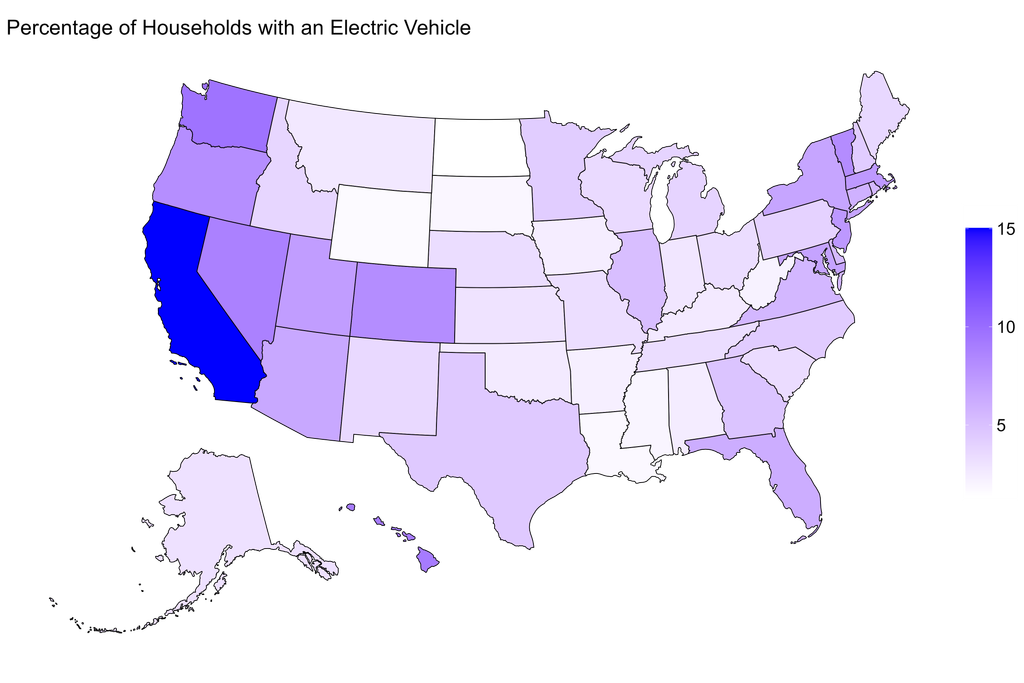
Here’s the national distribution:
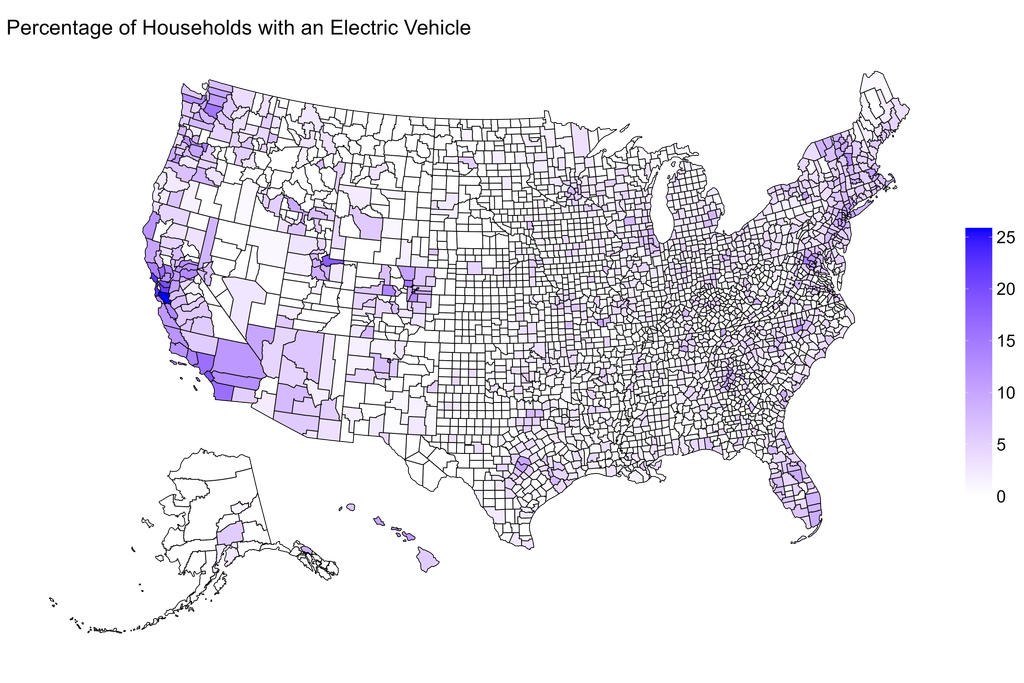
What about at the county level? Here’s the national chart:
It’s kind of hard to see the leaders, so let’s do just California since that’s where they all are:
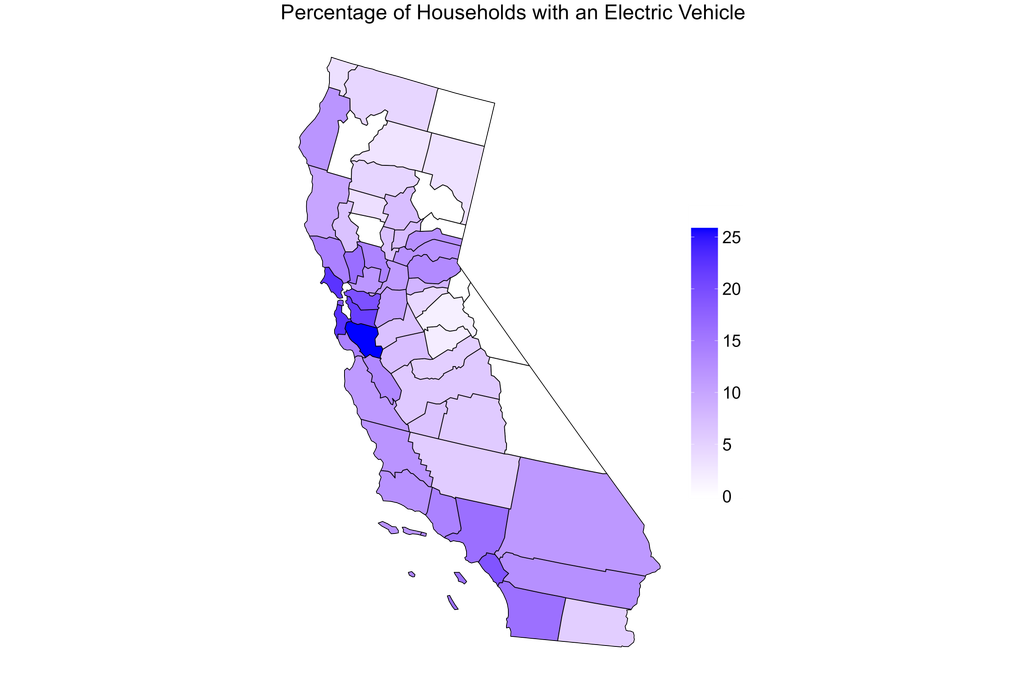
The heaviest adopters are in the Bay Area, as this Top Five listing shows:
| County | Percentage of households with EVs |
| Santa Clara County, California | 25.8 |
| San Mateo County, California | 22.6 |
| Marin County, California | 22.5 |
| Alameda County, California | 21.4 |
| Contra Costa County, California | 19.5 |
Because EVs are so prevalent the Bay Area, it tends to mask usage patterns in the rest of the county: in the US county map earlier, the colors are muted in comparison. Even a county in the top 10 shows up violet instead of dark blue. I can avoid this by setting the maximum scale to 15% instead of 25%. Thirteen counties are above this level – they will all show up as the same dark blue color, so we lose some detail there. But in return, we get a lot more definition in the rest of the country. Now, high EV users show up all over the place:
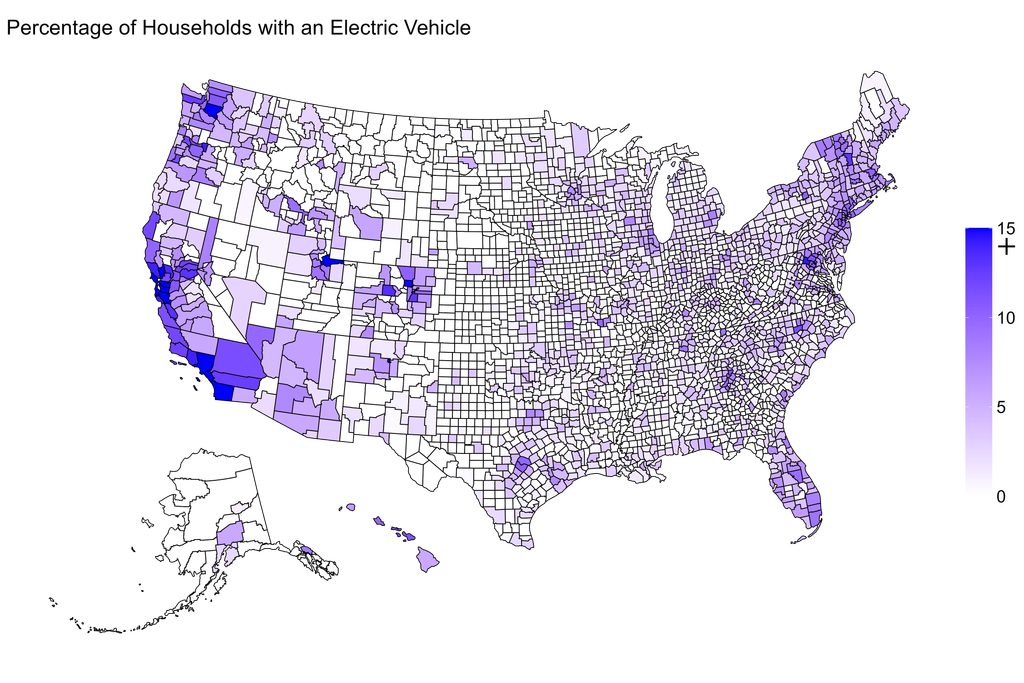
The highest areas are urban pockets scattered around the country. That makes sense – it’s where the charging infrastructure is more built up. There are a few surprises: Vermont, Utah, and large swaths of Florida.
I’m unable to drill down below the county level, to a more granular geographic component (say, census blocks). The ACS surveys about 3.5 million households a year (2.5% of the US total). That’s just not enough data to provide accurate estimates at smaller geographic sizes. The 5-year ACS results (which rolls up five years of data) will provide this level, so by 2030 we’ll be able to look at EV adoption at the neighborhood level.
Finally, the same data set contains a nugget of info completely unreleased to electric vehicles: the percentage of households that don’t have any vehicle (again, motorcycles and e-bikes are not included here). The top two “states” are Washington D.C. (38.0%) and New York (30.9%). D.C. makes sense – its a dense urban environment, with mass transit and lots of politicians and lobbyists who can afford limos and taxis. And most of New York state’s population lives in or near New York City, and there are many good reasons for not owning a car in New York City. Here are the top twelve counties in America:
| County | Percentage of households with no vehicle |
| New York County, New York (Manhattan) | 81.9 |
| Bronx County, New York | 64.1 |
| Kings County, New York (Brooklyn) | 60.5 |
| Queens County, New York | 40.5 |
| District of Columbia, District of Columbia | 38.0 |
| Hudson County, New Jersey | 36.7 |
| Suffolk County, Massachusetts | 33.4 |
| Holmes County, Ohio | 32.6 |
| San Francisco County, California | 32.3 |
| Philadelphia County, Pennsylvania | 32.0 |
| LaGrange County, Indiana | 31.7 |
| Baltimore city, Maryland | 28.6 |
The first four are New York City boroughs. Then, D.C. as we’ve previously discussed. Hudson County is just across the river from Manhattan, as close to being part of NYC as you can be, considering you’re in another state. Suffolk County in MA is basically Boston. San Francisco, Philadelphia, and Baltimore – three more compact urban environments where owning a car may not be cost effective.
What about Holmes County in Ohio and LaGrange County in Indiana? Give yourself bonus points if you figured it out: both counties have large Amish communities.
Next time, I’ll look at another “green” initiative that ACS surveyed for the first time in 2025: solar panels.
