There’s a thing called the National Fire Incident Reporting System (NFIRS). Not surprisingly, it collects information on fire incidents from across the nation. It also collects other emergency incident data, like Rescue, Emergency Medical Service, Hazardous Conditions, and so on.
Let’s look at just fires for now. Before we dive in, note that NFIRS is a voluntary system. Fire Departments don’t have to contribute to it. It is estimated the data set comprises about 70% of all emergency incidents that occur annually. For 2022 (the most recent year of reporting), that works out to over 31 million incidents, of which 1.25 million were fires (a large majority of the 31 million calls are for emergency medical service).
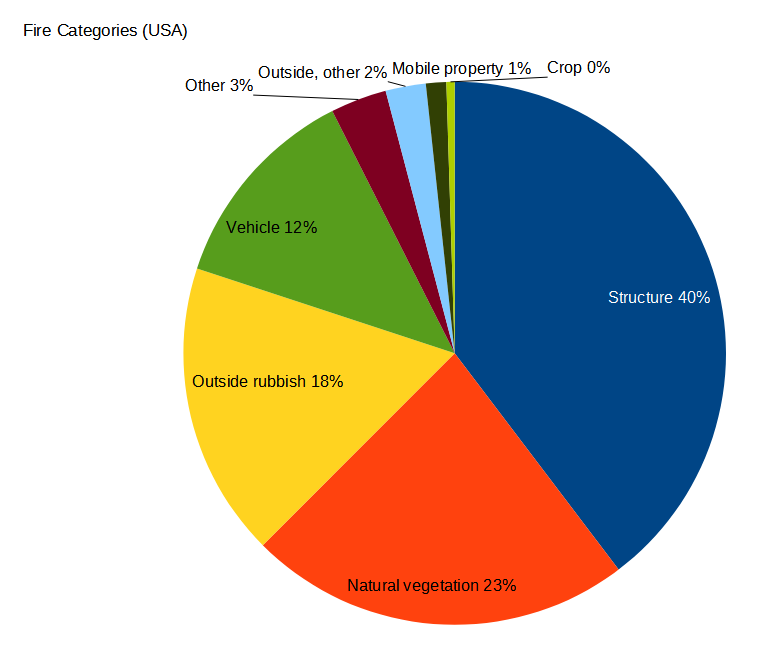
The system has eight main categories for types of fire. Each of those main categories are broken into subcategories, which I’ll get into in future posts. Here’s the distribution of each main fire type, across the country:

A quick summary of these categories:
- Structure – a fire in a building
- Natural vegetation – forest, brush, grassland, etc.
- Outside rubbish – trash, landfill, dumpster, etc.
- Vehicle – cars, trucks, trains, etc.
- Mobile property – “fire in mobile property used as a fixed structure”. Basically, mobile homes, RVs, motor homes, that are not actually mobile (mobile vehicles truly mobile are covered in the Vehicle category).
- Crop – farmland
- The two “Other” categories are basically miscellaneous fires that don’t fit into the major categories.
We need to be careful when looking at the state data. Since we don’t know which or how many fire departments are reporting, doing state-to-state comparisons is tricky. State A might have 90% compliance, while state B’s compliance might be 60%, so a per-capita comparison would be flawed: state B has an undercount of all types of fires, compared to its population.
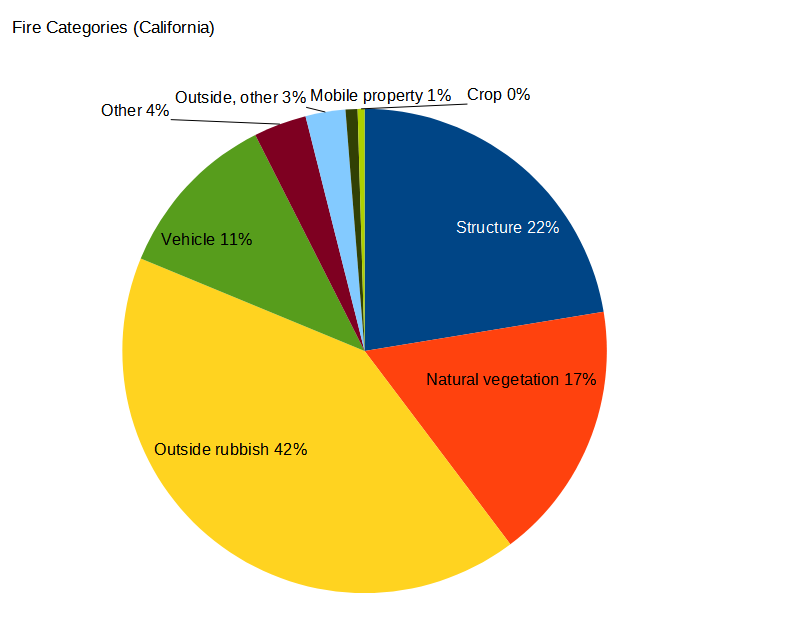
But we can get useful information by looking at distribution of the fire categories within a state. Even if the gross number of incidents is low or high (depending on report compliance), the relative ratio of the various fire types provides a glimpse of the state’s fire profile. For example, here’s the distribution for the state of California (compare it to the national chart, above):

What jumps out in this chart is the Outside Rubbish fire category – these types of fires are 2.3 times more frequent in California than nationally. So I’ll dig into this category first. Here are the top (and bottom) states, listing rubbish fires as a percentage of all fires:
| Most Rubbish Fires, as percentage of all fires | Percentage |
| Nevada | 41.8 |
| California | 41.5 |
| Hawaii | 35.7 |
| Washington, D.C. | 35.1 |
| New Mexico | 32.8 |
| Fewest Rubbish Fires, as percentage of all fires | Percentage |
| Delaware | 6.6 |
| Wyoming | 6.3 |
| New Hampshire | 5.7 |
| Maine | 5.4 |
| Vermont | 3.9 |
Why is there such a wide discrepancy in rubbish fires from state to state? My first thought was the unsheltered homeless: a fire built outdoors for warmth or cooking could easily get out of control and need fire department intervention. California has a lot of homeless; California has a lot of rubbish fires — could there be a relationship?
The first question to answer: is “rubbish fire” the category that captures these fires? It appears so. While there isn’t a specific subcategory for unhoused-related fires, the rubbish fire category appears to be a catch-all for fires that are outdoors but not in cropland or natural vegetation (see below for the exception). Each fire incident report includes an address, so I was able to spot check a subset of the Rubbish Fire incidents. Many occur in urban areas, and Google street view sometimes shows nearby homeless encampments.
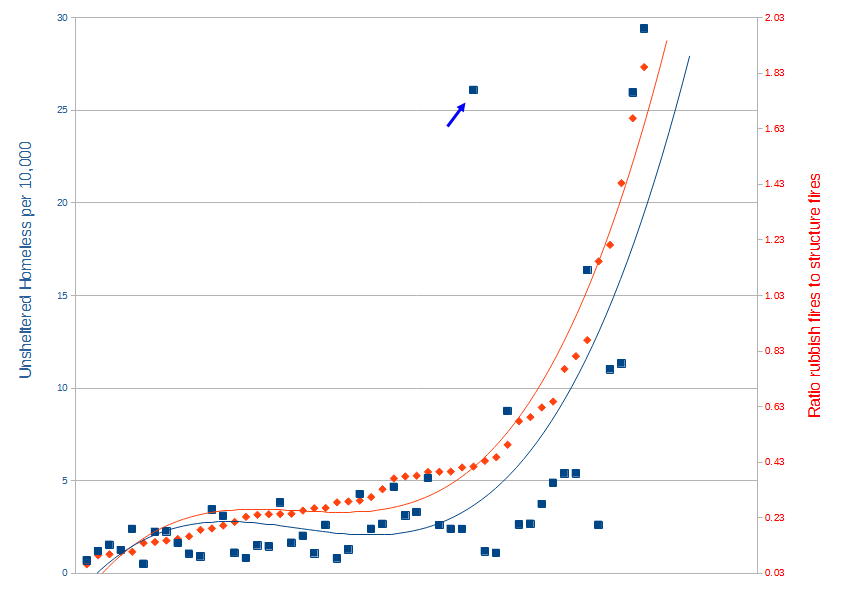
To test this hypothesis, I’ll plot each state’s homeless rate versus the rubbish fire frequency:

The blue squares/line represents the unsheltered homeless rate of each state.1I use the unsheltered homeless rate, rather than the total homeless rate, because a homeless person living in a shelter is unlikely to cause a rubbish fire The red diamonds/line is the frequency of rubbish fires, compared to structure fires (this eliminates natural vegetation fires and cropland fires, which can vary greatly from state to state). Visually there seems to be a relationship. Mathematically there is – a regression analysis results in an R2 of 0.74, so there definitely is some correlation. It’s not a perfect match, but it may explain at least some of those fires. Of course Correlation Does Not Imply Causation, so perhaps there is a third factor involved that is the root cause. But, given the spot checking I did that points to urban homeless areas, I wouldn’t be surprised if homelessness is involved to some extent.
You may have noticed that there’s one big outlier in that chart. The blue square with the arrow pointing at it, all by itself? That’s Oregon, which has a high rate of unsheltered homeless, but a low rate of rubbish fires. I tried to figure out this anomaly, and the best I could come up with is that it’s categorization issue. There are a couple of other ways to categorize these types of fires, besides “Outside Rubbish”. One comes under the Structure fire category, a subcategory called “Fires in structures other than in a building”. A homeless encampment or tent might be considered this. The other is in a non-fire subcategory, “Unauthorized burning”. The fire departments in Oregon use these two subcategories about five times more frequently than the US average, especially in areas with a high unhoused population. This would go a long way to explaining the discrepancy.
