Today let’s talk about wind. My Tempest weather station gathers three wind data points every minute: lull, average, and gust. That is: the lowest speed, the average speed, and the highest. From these we can get a picture of how the wind changes over the course of a day.
Here’s one way to visualize it. It’s a graph of the wind direction and speed over a 24-hour period, in this case April 1, 2023.
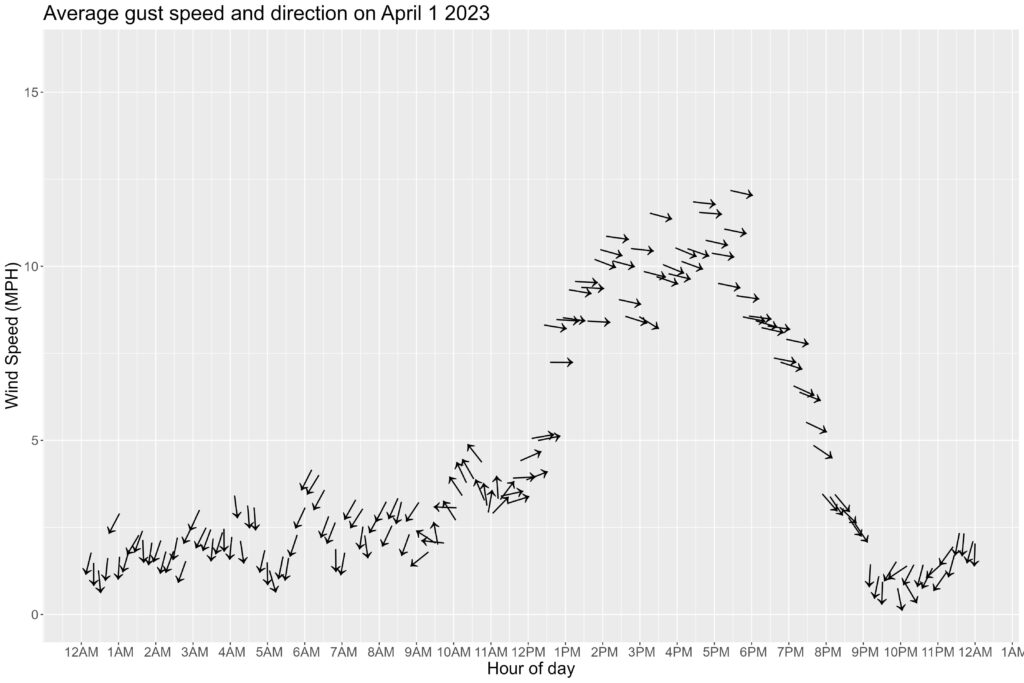
The horizontal axis is the hours of the day, midnight to midnight. The vertical axis is the speed of the wind, in miles per hour1For these graphs I use an “average gust”, which is calculated as follows: each minute, the largest wind gust is measured. Over 10 minutes, these values are averaged.. The wind speed is plotted at 10-minute intervals, as an arrow – the arrow points in the direction the wind is blowing.
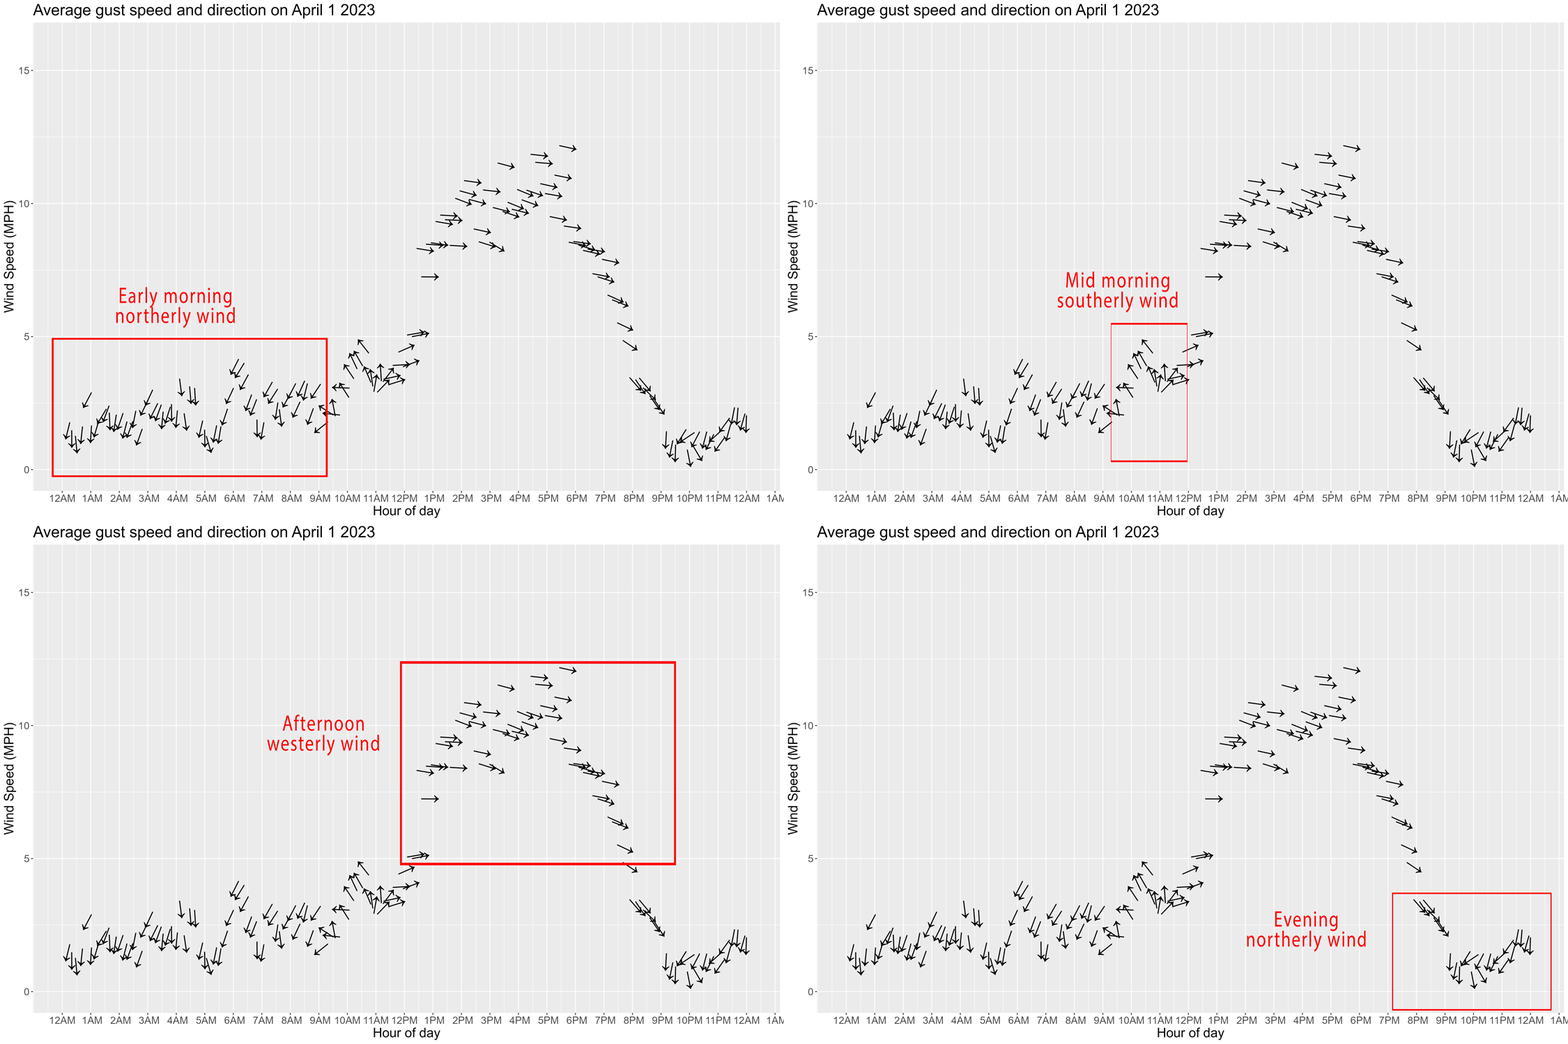
There are four wind patterns over the course of this particular day. Three, actually, since the first and last overlap at midnight. Here they are:
Another way of looking at a day’s wind is with something called a Wind Rose. It shows the speed, direction, and frequency of wind from each direction of the compass (the compass is divided into 12 parts). Here is the wind rose for the same day, April 1, 2023:
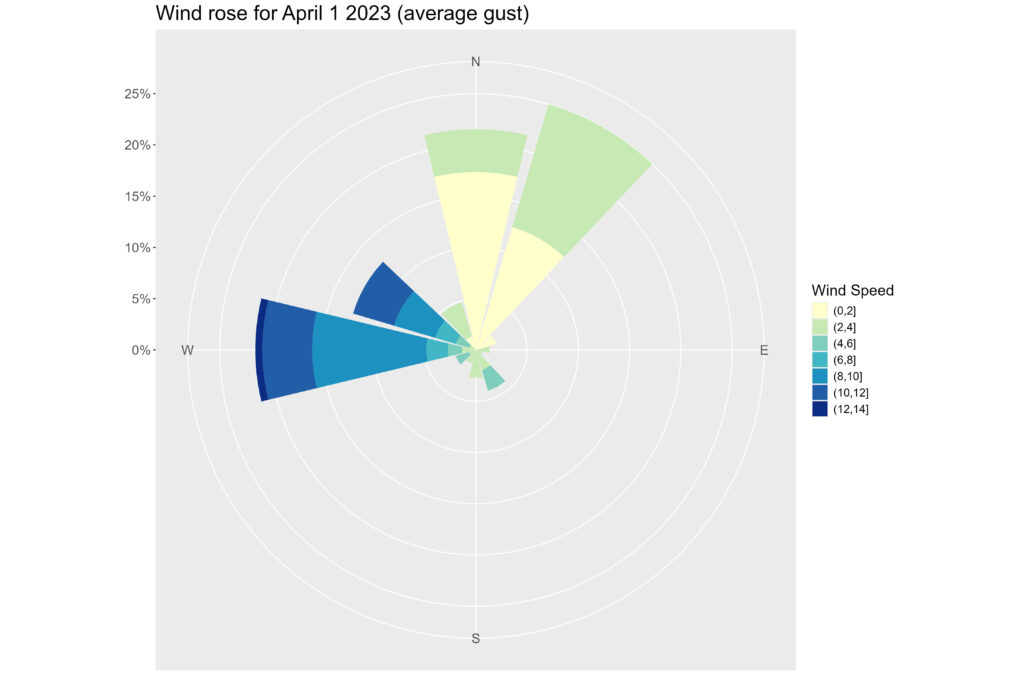
The size of each wedge is the relative percentage of the day that the wind was coming from that direction. The colors of the wedges reflect the wind speed. In this case, the light overnight northerly winds are represented with the large wedges (north, and north-northeast) of yellow and pale green. The stronger westerly winds show up as the bluer wedges. The tiny south-easterly wedge represents the brief time in the morning when the wind is transitioning.
Both style of charts are useful. The first one has the advantage of showing you the wind patterns at different times of the day. The second (wind rose) gives you a nice visual representation of strength and direction, but you lose the time-based data.
The wind pattern on April 1 is actually a pretty typical for our neck of the woods. To verify this, I’ll create these same two graphs, but this time I’ll average the values over the entire year. Here’s the hour-by-hour chart (for readability, this chart uses 20 minute intervals instead of 10):
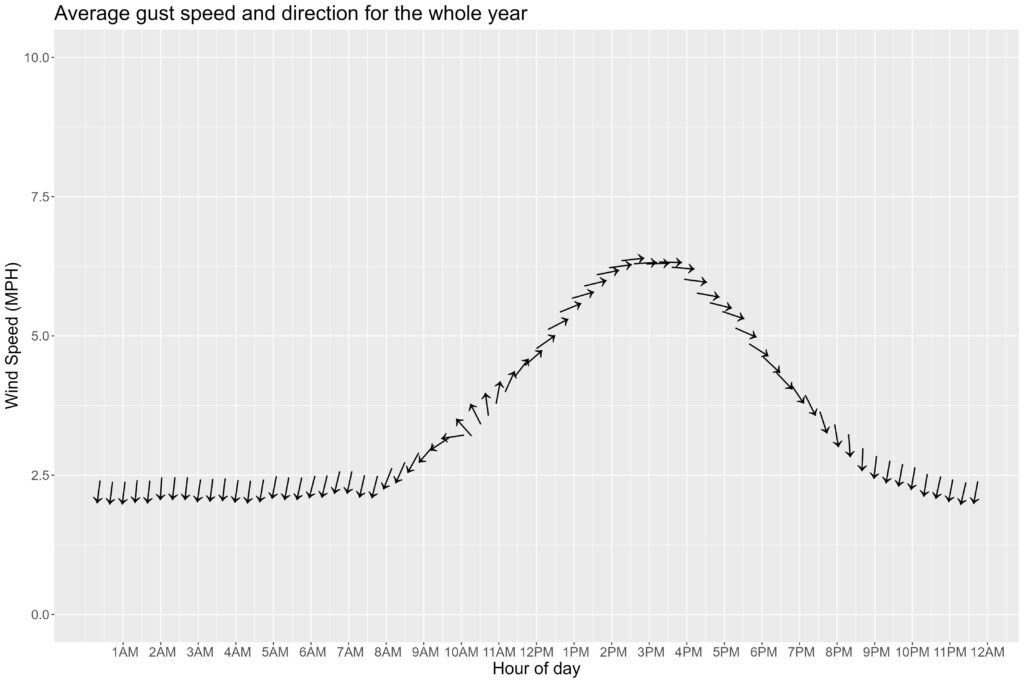
The day starts with weak northerly winds overnight. As the sun comes up, there’s a 270-degree swing to stronger afternoon westerly winds. Then, weakening winds that swing back to the overnight northerlies.
(You may be wondering why the gust speed seems so low in that graph, topping out at a mere 6.4 MPH. Surely, most days have sustained gusts2Averaged over 10 minutes larger than that? Indeed, they do. So why is the average so low? Because the gusty parts of the day happen at different times from day to day. One day, it might be from 2:00 – 2:20 in the afternoon; on another, from 3:20-4:00. Each day’s peak is high, but since the peaks happen at different times of day, the average smooths out to a lower level.)
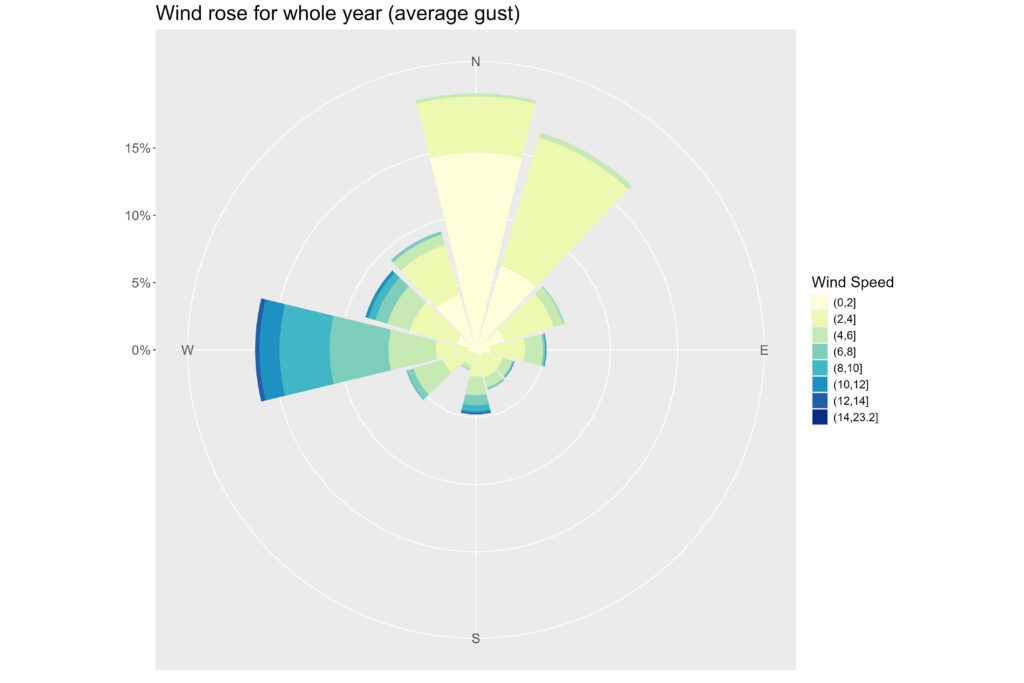
The wind rose for the entire year confirms the pattern from the hourly graph: lots of light northerly winds, stronger westerly winds, and a few scattered winds from other directions.
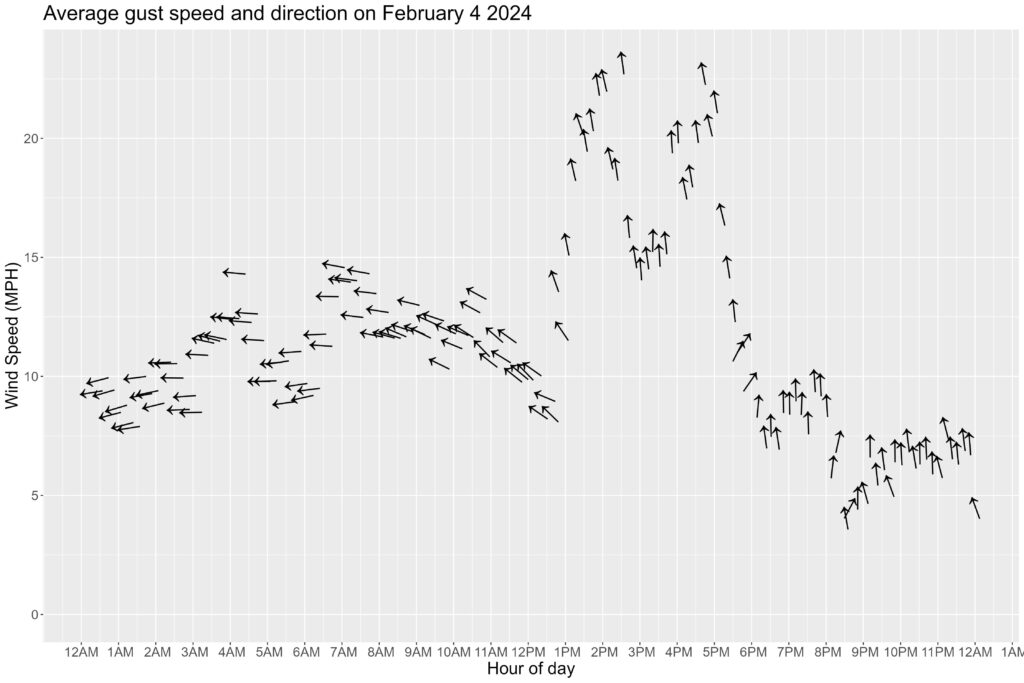
Let’s get back to individual days. The windiest day of the past 12 months was February 2, and it’s not even close. Here’s the wind gust chart:
And here’s the wind rose:
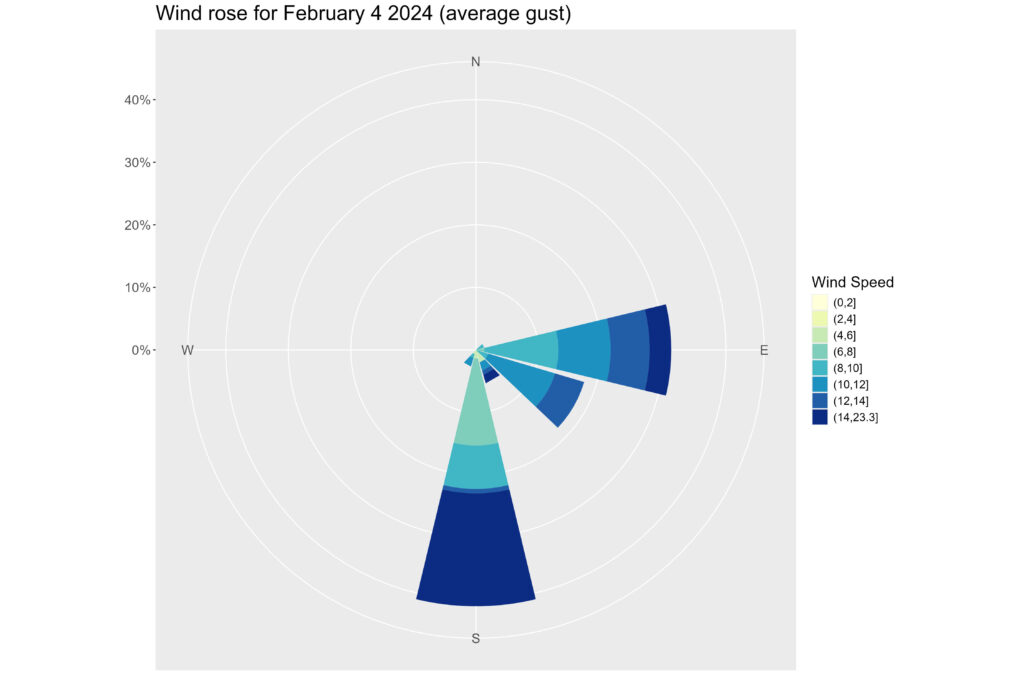
Over the whole day, the average wind speed (gust) was 11.6 miles per hour – this is about 30% faster than the next windiest day. This was a big storm (“bomb cyclone“) coming up from the south – atypical for Santa Cruz. Really, for the entire year, there are no other wind roses that look anything like this one.
Here’s the least-windy day:
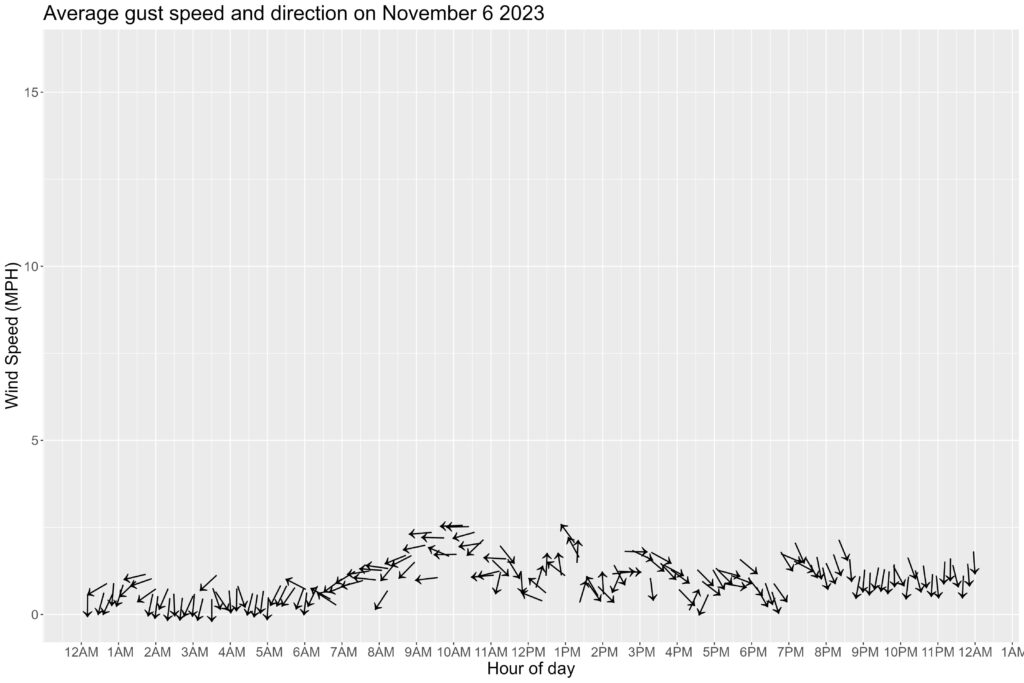
The average gust was just under 1 mile per hour (!). Once in a while there were gusty periods around 2-3 MPH, but that was it – nothing stronger. Here’s the wind rose:
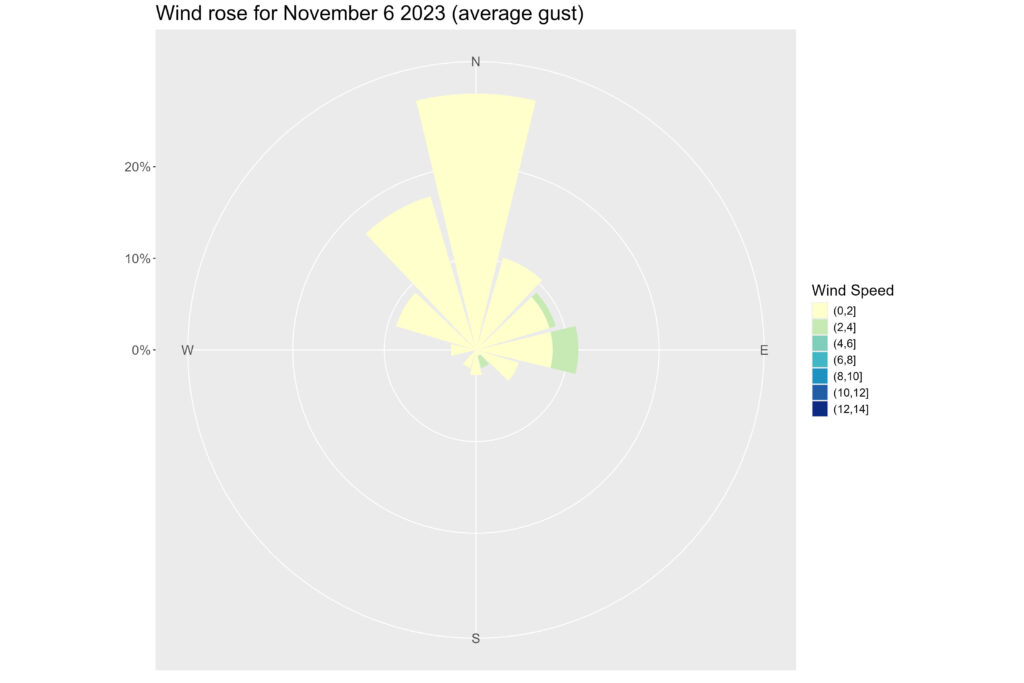
Twenty percent of the time, there was no discernable wind at all. There was a 15-minute stretch (3:20 – 3:35 AM) where there was absolutely no wind at all – no measurable gusts of any speed. Dead calm, the sailors call it – must have been spooky.
As for wind direction, what was the most one-sided day? That would be this one:
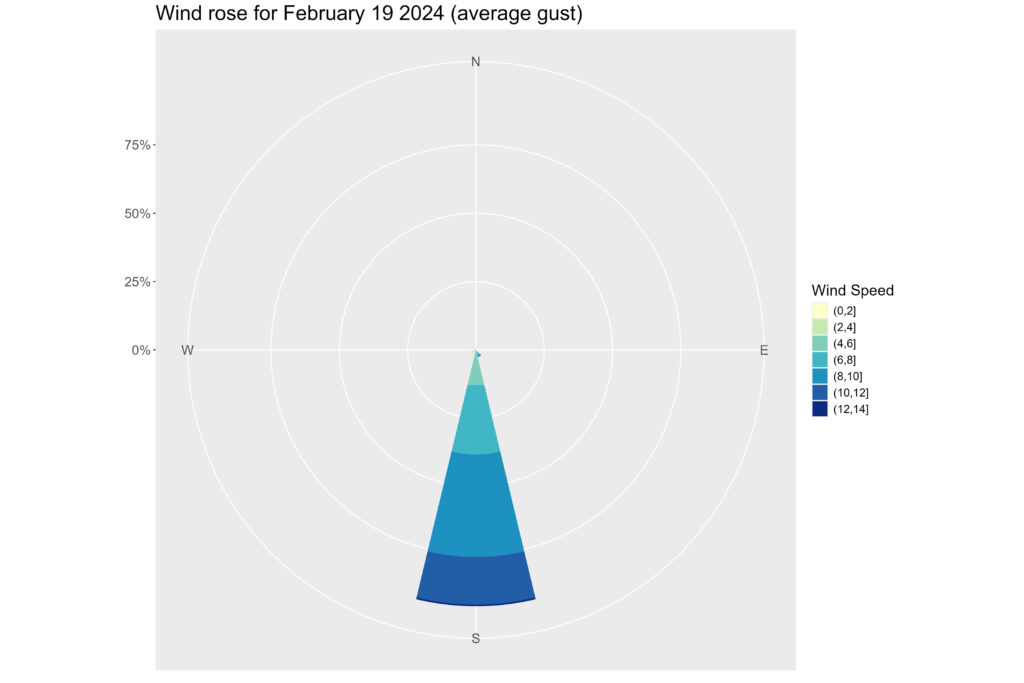
Around 1 AM, the wind started coming solely from the south, and stayed that way for the rest of the day. And into the next day too, until around 5:30 AM. That’s 28 hours straight where the wind came only from the south, with almost no fluctuation in direction (within 20 compass degrees).
On the opposite end of the spectrum, August 7th was all over the map (literally):
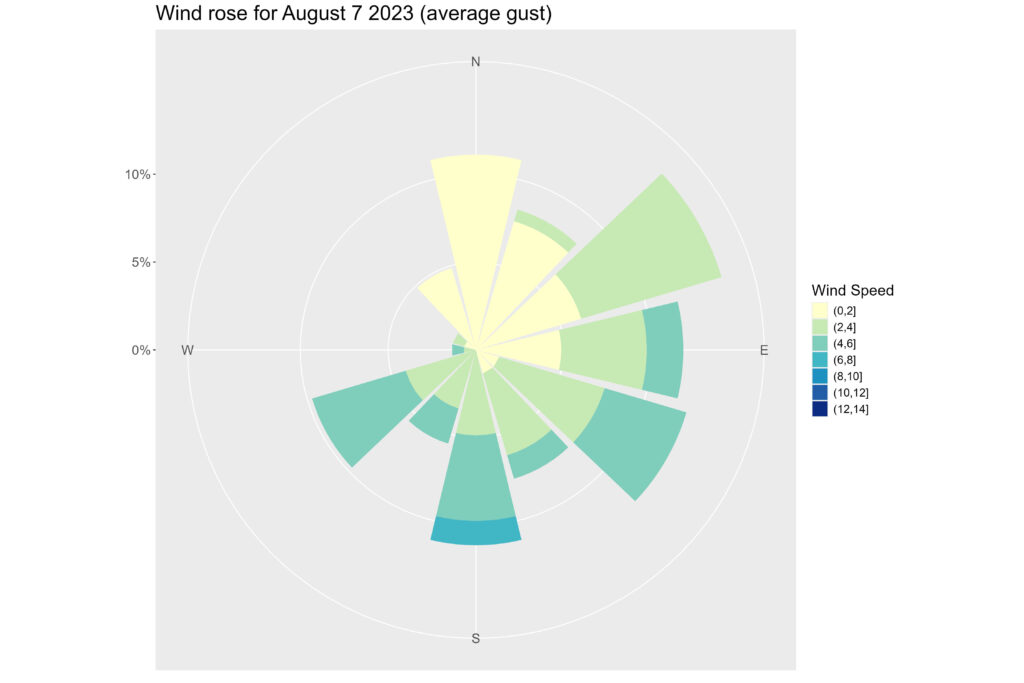
Here’s the graph over time:
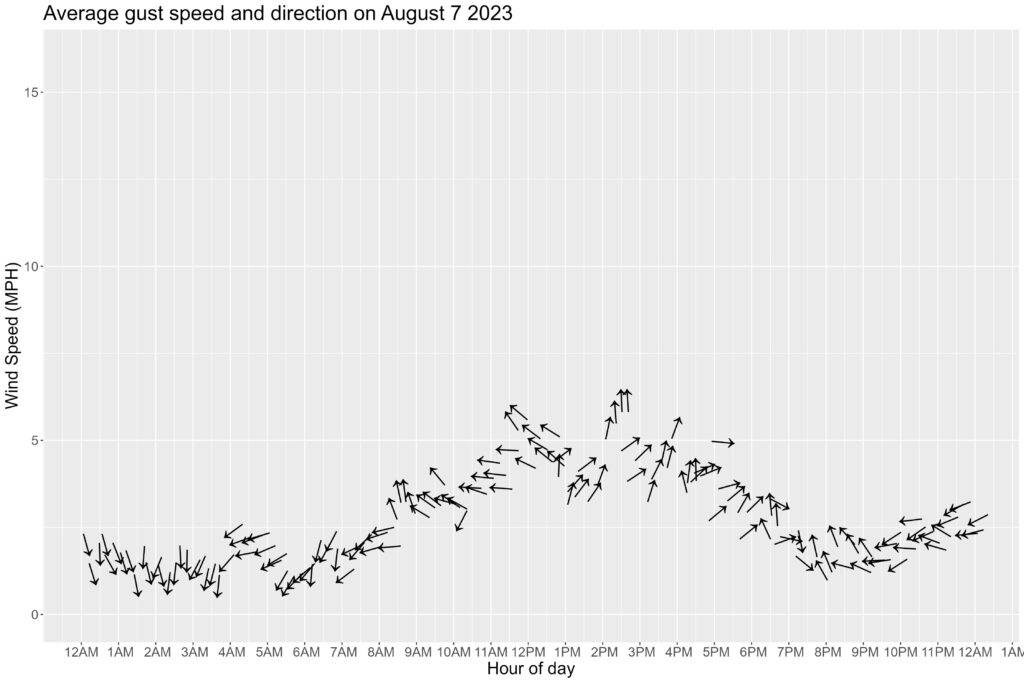
The wind really couldn’t decide what it wanted to do that day.

The night wind is a land breeze (from the north, here) and the day wind is a sea breeze. It’s the earth breathing 🙂