Last March, I purchased a personal weather station.1Tempest weather station This device sits in my backyard and captures all sorts of weather data – temperature, wind, rain, etc. – and reports it once a minute. Now that I’ve got 6 million points of data, what am I waiting for?
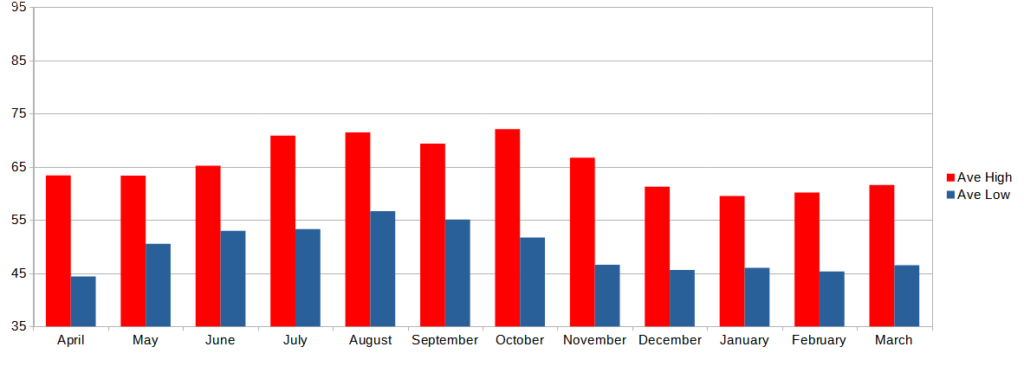
I’ll start with temperature. Santa Cruz has a fairly mild climate, and the area I live in is near the ocean, which further moderates the temperature. This is evident with a plot of the average monthly high & low temperatures, over the course of a year (April 2023 – March 2024).
Of course, averages tend to smooth things out. Here are the actual daily high and lows over the same period, which displays a lot more jaggedness:
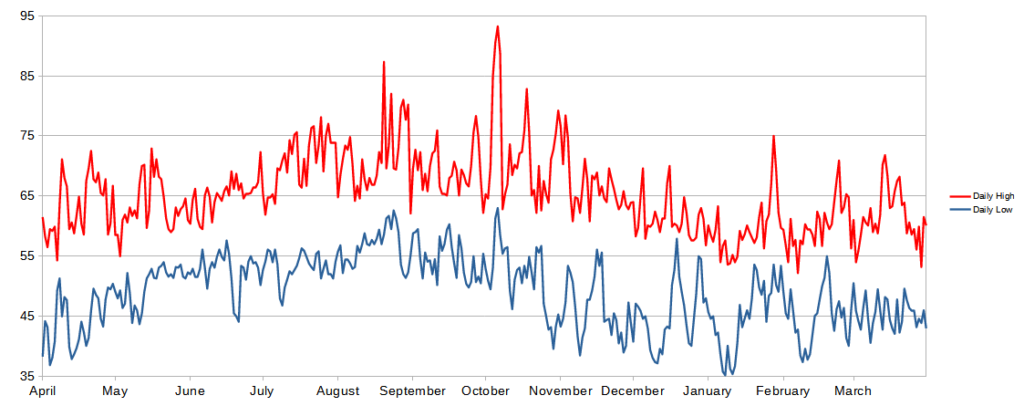
Averages are useful, but they do obscure the variations. It’s accurate to say that the average high in October last year was 72. But that misses quite a few peaks and troughs: 65 on October 2nd, then up to 93 on the 6th, plummeting down to 63 just two days later, then back up to 83 on 18th, down to 62 a week later, then finishing the month at 79 on Halloween. Quite the ride.
And indeed, October had the most variation in high temps, as measured by standard deviation. At the other end of the scale, June was the quietest month (basically, the entire month saw highs between 60 and 69. June Gloom indeed).
Since the station reports once a minute, we can track temps over the course of a day. Here’s the plot for a random day, March 14th, 2024:
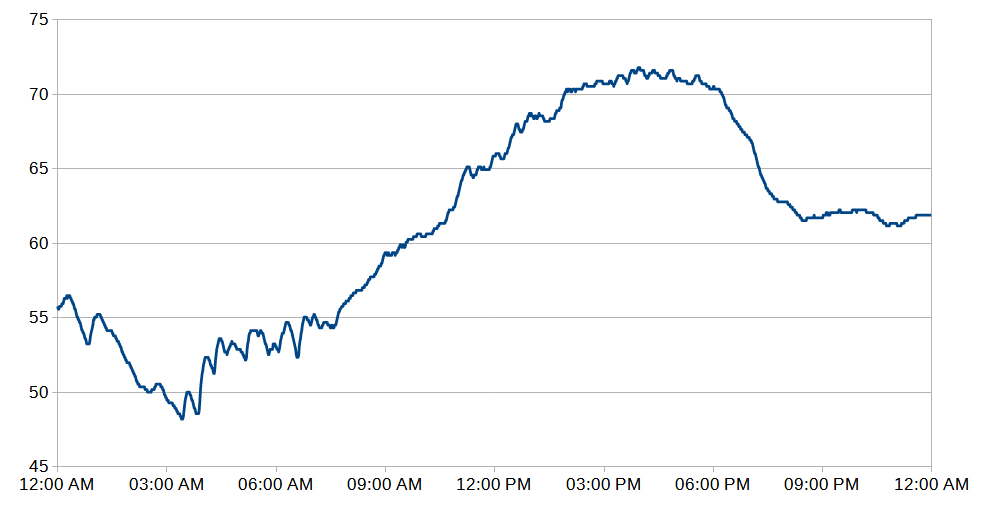
But that’s just one day. We can average every minute of the 24-hour day, across all 366 days of the past year. And the plot of that looks like this:
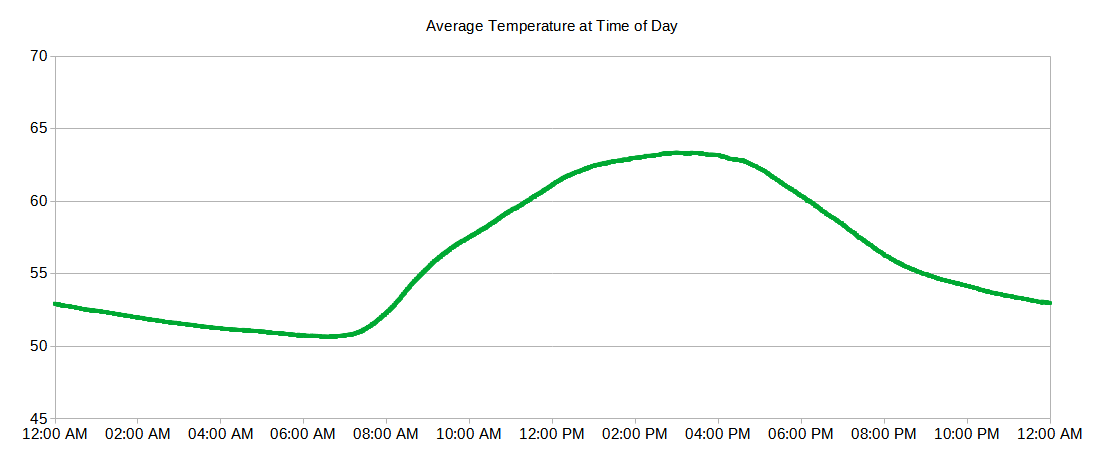
The temperature cools off overnight, typically reaching the low around 7 AM. Then it warms up fairly quickly until noon, then slowly until the high (around 3 or 4 PM). Then it starts cooling overnight.
That’s for the whole year. What about different seasons? Interestingly, the graph has a similar shape no matter what time of year we look at. This next plot includes the four warmest months (July – October) and the three coldest (December – February).
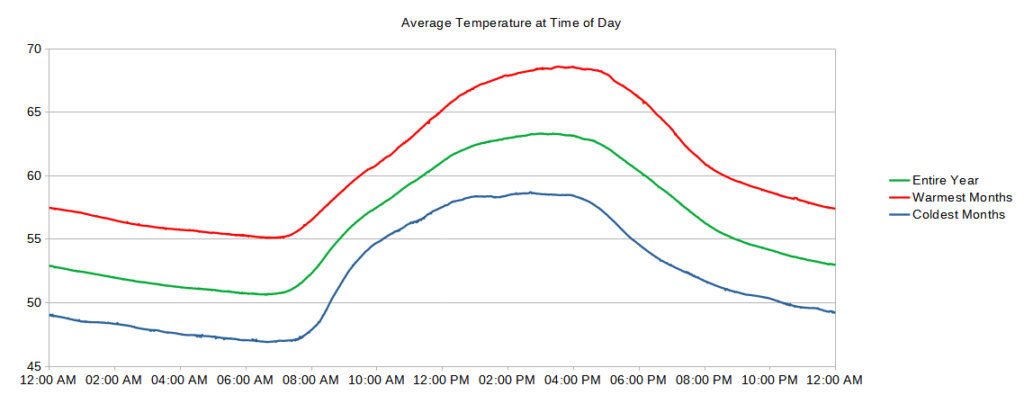
The plots look remarkably similar. I would have thought that the longer daylight hours in summer vs. winter would skew the graph in some way, but it doesn’t appear to. But let’s check this. I’ll adjust the lines so that they overlap (give them the same starting and ending points). So now it’s a graph of the relative temperature changes over the course of a day.
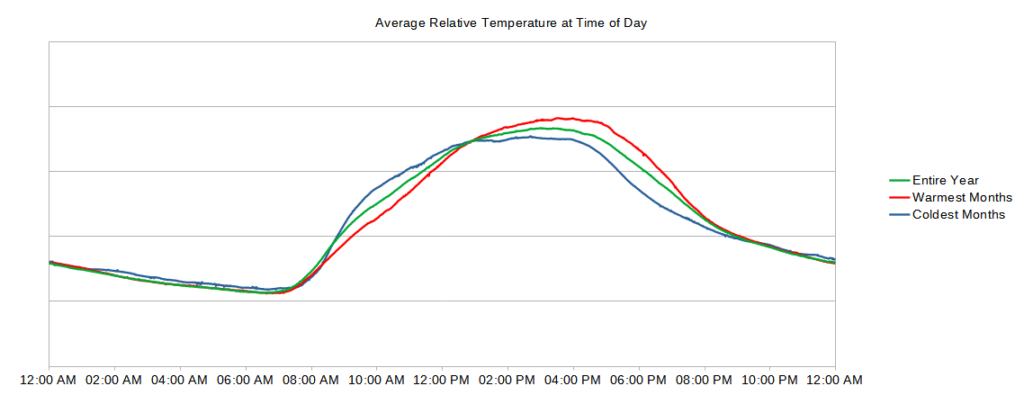
Now the differences jump out. At night, the relative behavior of these three lines is the same. But during the day, we see changes. In the morning, winter days heat up faster – the blue line is well above the other two. I’m not sure why this is the case. By noon, the lines are back to overlapping. But in the afternoon, summer days heat longer, and the red line towers above the others. I suspect this is simply because in summer there’s more sunlight over a longer number of hours.
Okay, that’s how temperature varied over the average day. But what about the extremes? Specifically, what day had the most variation in temperature, and which had the least. I measure this by comparing the temperatures minute-by-minute, and totaling these variations over the entire day. The day with the most variation was October 31st:
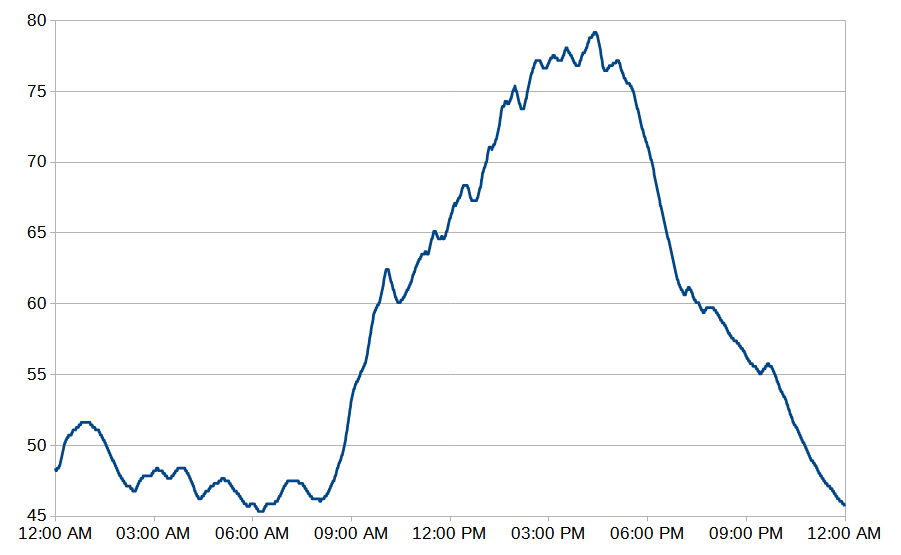
Over the course of the day, there was lots of up-and-down temperature variation, as well as a 30-degree spike from morning to afternoon. It cooled off pretty quick too.
The smoothest day, temperature-wise, was December 19th:
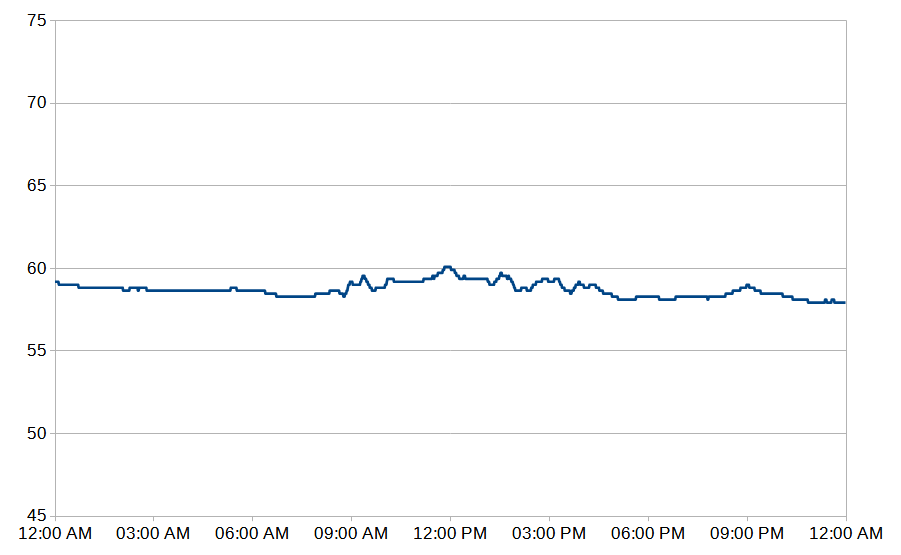
I actually remember that day; it rained in the early morning, then it was cloudy all day. Almost no wind either (average wind speed was 2 MPH). It was a weird one – felt like we were stuck.
Finally, here are the extremes for temperature changes over a short period of time (60 minutes, 30 minutes, and 5 minutes):
| Event | Start Date/Time | Change (deg) | From | To |
| Largest rise in 60 minutes | November 10, 7:48 AM | 15.1 | 42.3 | 57.4 |
| Largest rise in 30 minutes | November 20, 8:08 AM | 9.9 | 46.9 | 56.8 |
| Largest rise in 5 minutes | October 29, 3:47 AM | 3.1 | 45.0 | 48.1 |
| Largest drop in 60 minutes | October 7, 5:01 PM | -16.9 | 87.4 | 70.5 |
| Largest drop in 30 minutes | August 20, 4:54 PM | -12.6 | 86.4 | 73.8 |
| Largest drop in 5 minutes | August 20, 5:07 PM | -6.5 | 84.9 | 78.4 |
The big rises occur on sunny days in autumn: after a cold overnight, the air heats up quickly in the morning hours. As for fast drops in temperature, those tend to happen in late summer. These have to do with late-afternoon wind shifts, something I’ll cover next time.

2 thoughts on “A Year of Weather”