This is the third and final analysis of the Microsoft building data (see here and here for the first two).
I decided to crunch the numbers on all 50 states (plus the District of Columbia). The MS database reports over 125 million buildings across the nation; here are the stats broken down by state and sorted by median building size (largest to smallest). Again, these are the building footprints – how much area they take up on the ground:
| State | # of buildings | Average size (sq ft) | Median size (sq ft) |
| Florida | 6,903,754 | 3339 | 2459 |
| Arizona | 2,555,388 | 3170 | 2443 |
| Hawaii | 252,891 | 3140 | 2399 |
| Nevada | 932,025 | 3250 | 2321 |
| California | 10,988,522 | 3194 | 2286 |
| Texas | 9,891,538 | 3056 | 2184 |
| Louisiana | 2,057,366 | 2918 | 2107 |
| Georgia | 3,873,550 | 3081 | 2085 |
| Utah | 1,004,732 | 3030 | 2058 |
| Oklahoma | 2,091,149 | 2759 | 2000 |
| Alabama | 2,460,409 | 2880 | 1998 |
| Mississippi | 1,495,853 | 2978 | 1996 |
| Arkansas | 1,508,625 | 2947 | 1993 |
| New Mexico | 1,011,376 | 2936 | 1990 |
| Oregon | 1,809,555 | 2689 | 1976 |
| Tennessee | 3,002,544 | 2765 | 1933 |
| Idaho | 883,596 | 2648 | 1924 |
| Colorado | 2,080,809 | 2715 | 1914 |
| Delaware | 345,913 | 2871 | 1912 |
| Washington | 2,993,363 | 2588 | 1894 |
| South Carolina | 2,180,518 | 2724 | 1892 |
| Indiana | 3,268,330 | 2711 | 1841 |
| Missouri | 3,141,263 | 2577 | 1828 |
| Maryland | 1,622,815 | 2921 | 1826 |
| North Carolina | 4,561,256 | 2661 | 1813 |
| Kansas | 1,596,496 | 2619 | 1787 |
| Virginia | 3,057,036 | 2608 | 1751 |
| Kentucky | 2,384,233 | 2507 | 1748 |
| Illinois | 4,855,787 | 2694 | 1733 |
| New Jersey | 2,480,298 | 2764 | 1731 |
| Wisconsin | 3,054,456 | 2656 | 1725 |
| Minnesota | 2,815,786 | 2531 | 1703 |
| Ohio | 5,449,391 | 2588 | 1702 |
| Connecticut | 1,190,269 | 2550 | 1700 |
| Alaska | 110,746 | 2549 | 1686 |
| Pennsylvania | 4,850,251 | 2618 | 1670 |
| Iowa | 2,035,684 | 2538 | 1629 |
| Nebraska | 1,158,091 | 2496 | 1628 |
| Wyoming | 380,776 | 2351 | 1627 |
| District of Columbia | 58,328 | 4666 | 1616 |
| Massachusetts | 2,032,998 | 2427 | 1600 |
| New York | 4,844,493 | 2499 | 1585 |
| Michigan | 4,900,480 | 2414 | 1579 |
| New Hampshire | 563,503 | 2279 | 1559 |
| Vermont | 345,892 | 2202 | 1557 |
| South Dakota | 649,745 | 2468 | 1548 |
| Rhode Island | 366,789 | 2275 | 1545 |
| Montana | 762,286 | 2235 | 1538 |
| North Dakota | 559,162 | 2549 | 1537 |
| West Virginia | 1,020,013 | 2125 | 1528 |
| Maine | 752,046 | 2019 | 1411 |
| Total | 125,192,175 | 2784 | 1912 |
Note that the median footprint goes from 1411 (Maine) to 2459 (Florida) – that’s a pretty big range. I think there are a couple of reasons for this.
- At the top of the list you’ll find states that tend to build one-story homes (Florida, Arizona, California) – in these states, you build out, not up. Whereas in states near the bottom (e.g., Maine), 2 or 3 story homes are more likely. A smaller footprint, but maybe just as much interior square footage.
- No matter what the region, over the past several decades newer homes are being built larger than older ones. So regions with growth will tend to have larger median footprints, because they have a greater percentage of newer buildings.
There may be other factors, relating to the types of industries a state has, but since homes dominate the quantity of buildings in a state, I suspect this is a minor factor.
Let’s look at the distribution of building sizes across the entire nation:
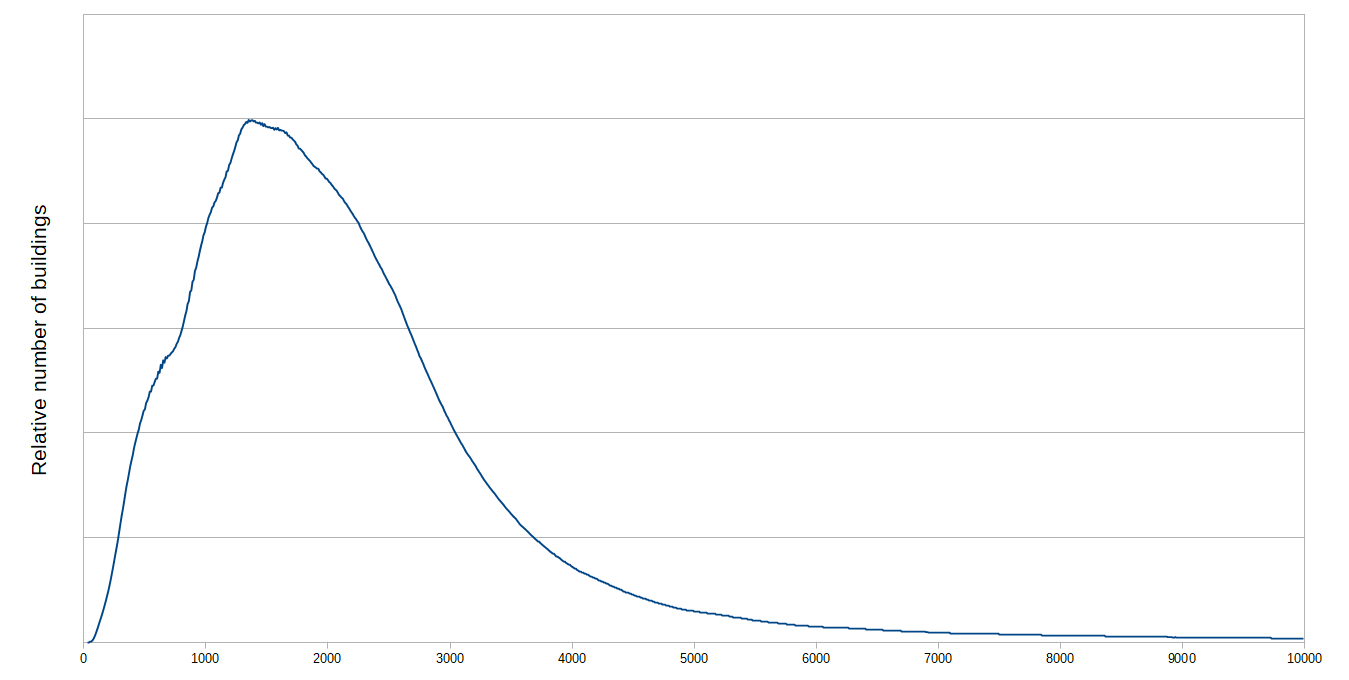
It’s a fairly smooth curve, with only a slight hint of the “California bump/dip” I discussed in the previous post. Most states don’t have the bump/dip, but a few do and it’s just enough to add a slight glitch to the curve around 700-800 square feet.
The distribution curve for most states is unexciting. But there is one weirdo, North Dakota:
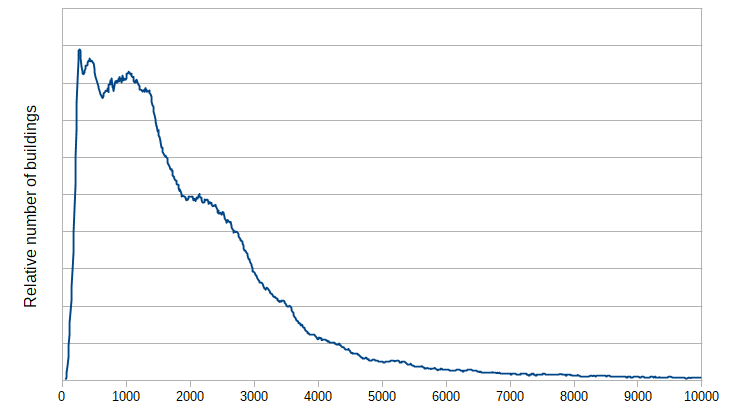
That’s right, the most common building size in North Dakota is about 240 square feet. No, they don’t all live in hobbit holes. Turns out that the Flickertail State is full of these:

Grain bins (not silos – get it straight!). Seems like every farm has a bunch of them, and they appear to outnumber houses in North Dakota. And, of course, they show up in the Microsoft database as buildings. Which they are.
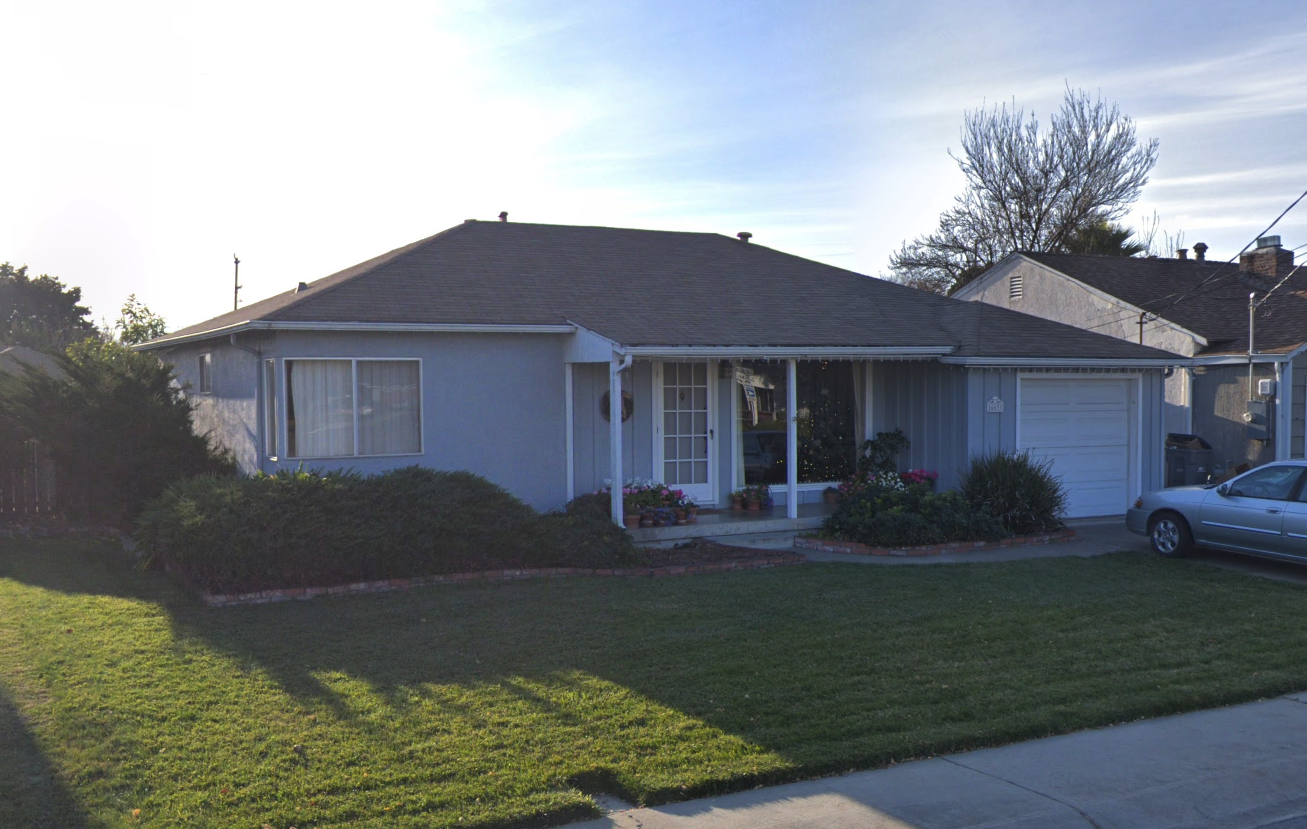
As for the footprint size of the median building in the entire USA, the answer is 1912.42356 square feet. That is, if you list all 125 million buildings in order of size, a building that is 1912.42356 square feet is smack in the middle of the list. Which specific building is this? Turns out it’s a house in Massachusetts. But the inaccuracy of the Microsoft data means that we really can’t be sure. It could be this one in California:
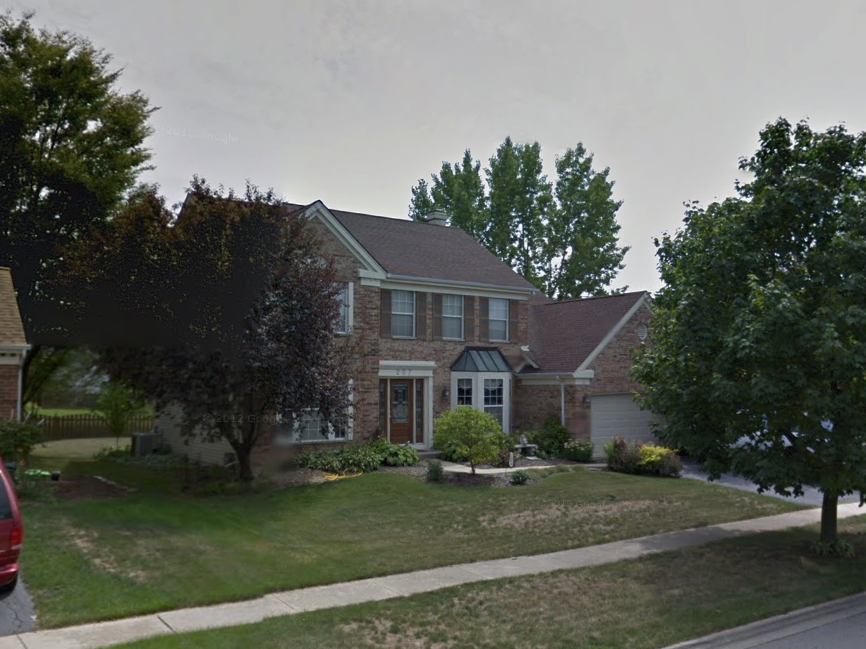
or this one in Illinois:
or this one in Maryland:
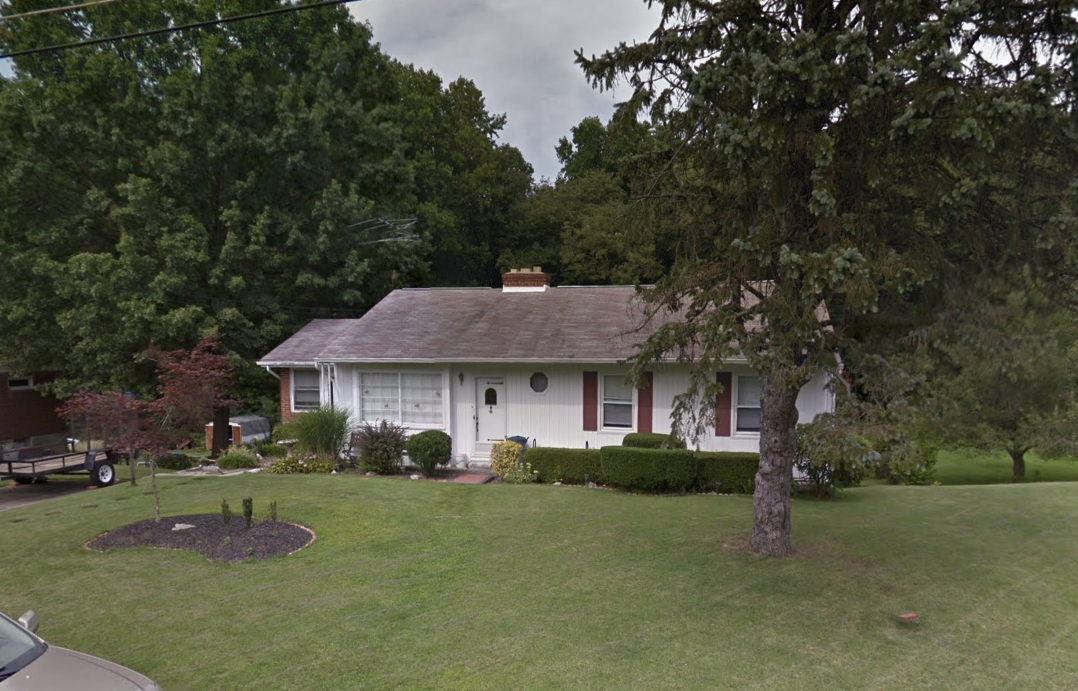
They are all extremely close to that median number. There are more than 44,000 buildings in the United States that have a footprint of 1912 square feet (rounded down to the nearest square foot). In fact, you can take the precision even further: 1912.42356 square feet is 1912 square feet plus 61 square inches. If you calculate building footprint to the nearest square inch, there are 293 buildings in this country that are exactly that size.
I have to reiterate: the Microsoft data are estimates of the building’s footprint, based on complex analysis of satellite imagery. So this data isn’t accurate to the square inch. I can’t say that those 293 specific buildings are exactly 1912 square feet plus 61 square inches. But, over the vast quantity of buildings, the measurement errors will even out. So it’s safe to say that there are 250-300 buildings somewhere that are that size – even if we can never measure them to that accuracy.
To me, that’s just mind-boggling, that there are hundreds of buildings in this country that are 1912 square feet plus 61 square inches, and hundreds more that are 1912 square feet plus 62 square inches, and hundreds more that are….you get the idea. This is a big country.
