Yes I know that’s not really a word.
Here comes more analysis of Microsoft’s massive database of buildings. I’m still focusing on California (10 million buildings is enough to deal with for now). Let’s start with the distribution of the building sizes. Remember, these are the sizes of the footprints of the buildings (square footage on the ground; nothing to do with their heights).
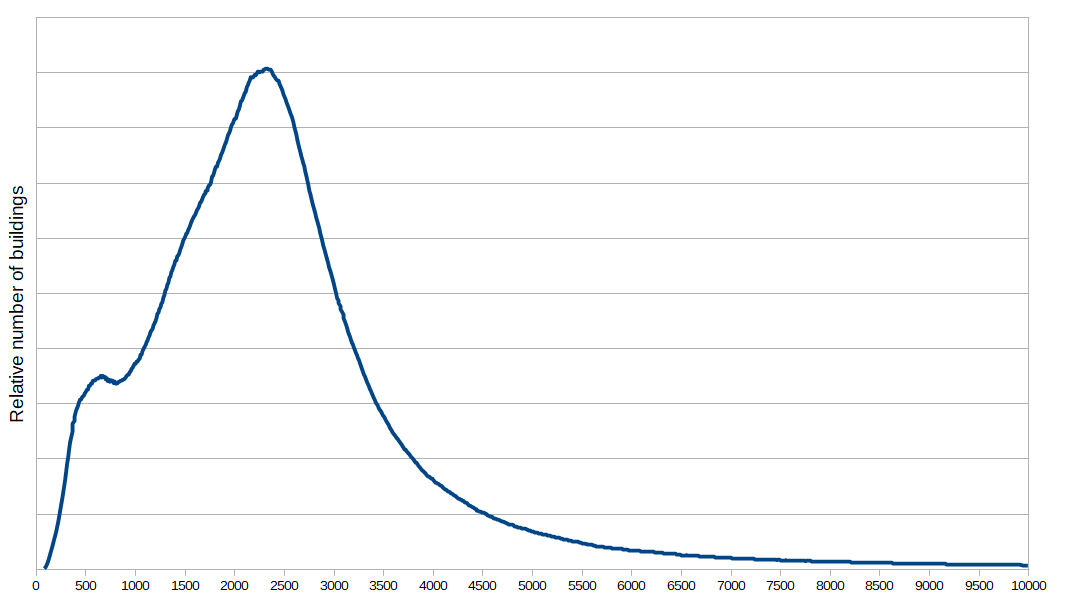
The most common building sizes are in the range of 2000 to 3000 square feet. This makes sense, because most of the buildings are single-family houses, and houses are frequently in that range. (There are a couple of things that distinguish these numbers from the familiar “square footage” measurement in the real estate business: 1) real estate square footage is the sum of the interior room sizes, not the exterior size that the Microsoft data calculates, 2) many houses have attached garages, which are not included in real estate calculations but are part of the exterior footprint.)
(Also, note that there are 10s of thousands of buildings off of the right side of the graph (greater that 10,000 square feet). Almost all of these are businesses).
So the most common building size is around 2400 square feet. What about the median size? Defined as: if you take all 10,988,522 buildings and rank them in size, which one is smack in the middle of that list? According to Microsoft, that would be this one:
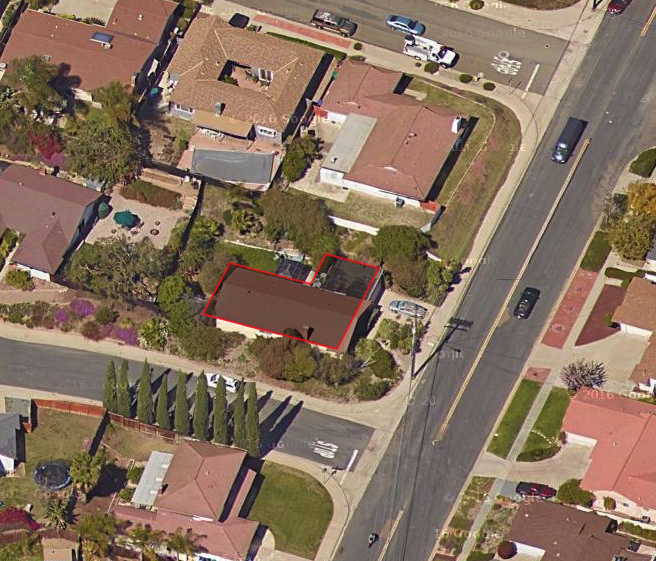
A 3-bedroom, 2-bath, 1400 square foot home with an attached 2-car garage, built in 1969. If you had to pick a typical California home, this would be a decent choice. The database reports it as 2285.626772 square feet. Despite the precision of that number, I can pretty much guarantee that this home is not the actual median building. The two main reasons: 1) The Microsoft database has ‘false positives’, in that its algorithm mistakenly identifies areas as a building where no such building exists (example: a farm field is identified as a building). Removing those from the list would result in a new median point. 2) The footprints that the Microsoft algorithm generates aren’t spot-on, certainly not when compared to a surveyor or even someone with a tape measure. So to specify that house’s footprint size as 2285.626772 square feet is ludicrously precise.
On the other hand, it’s safe to say that that house is pretty darn close to the median. Even if the median moved thousands of slots up or down the list, the building size wouldn’t change much. There are over 200,000 buildings between 2500 and 3000 square feet. In fact, there are 4,527 buildings that come in at exactly 2585 square feet (rounded to the nearest square foot)! Whatever the “real” median building is, it isn’t much different than the pictured one.
Finally, one thing that stands out in the distribution chart is the bump/dip around 500-900 square feet. The rest of the graph looks like a typical Bell curve, but then there’s this hiccup (circled in red):
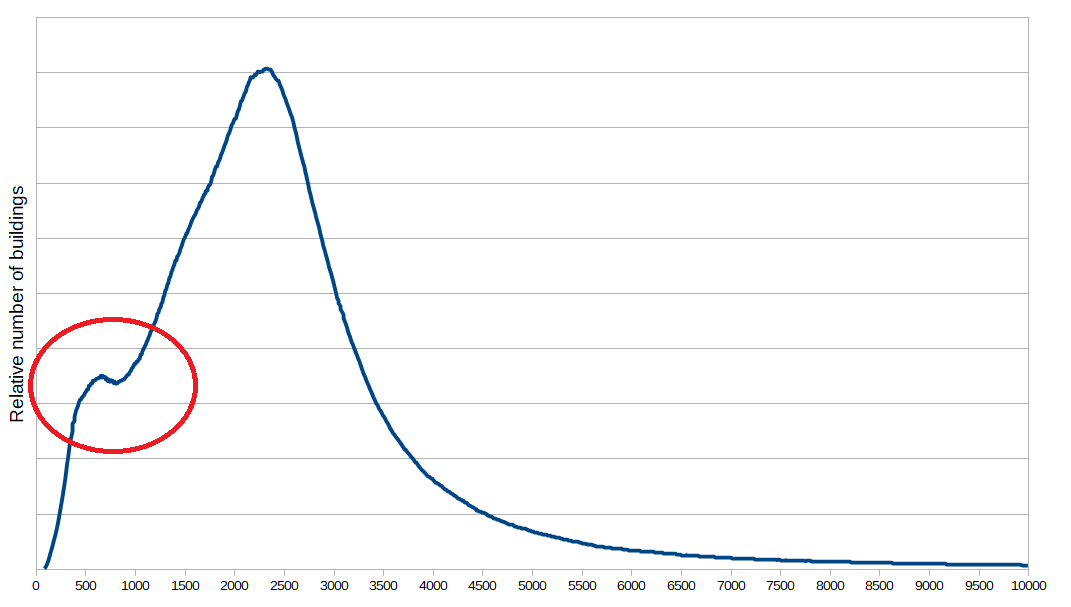
Generally, this shape of curve indicates a bimodel distribution: there are two distribution curves superimposed on one graph. Here’s an example, using randomly generated data. The graph below is a plot of two separate sets of numbers, each normally distributed:
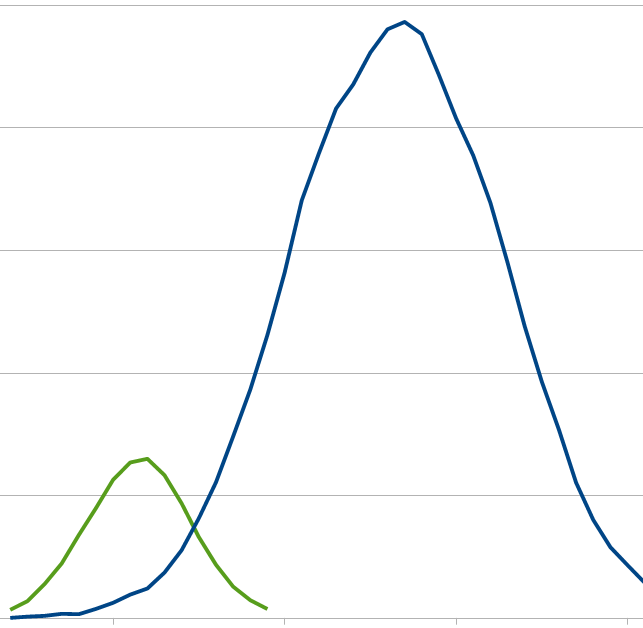
If you add those two curves together, you get this:
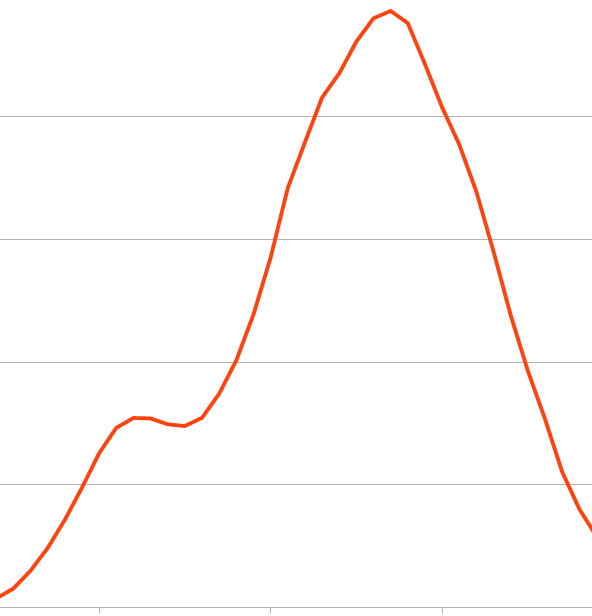
Which looks a lot like our curve. So that explains what we’re seeing. With the California data, the smaller curve peaks at around 650 square feet and drops off precipitously; the larger curve takes over from there. What does the smaller curve represent? Mostly detached garages. I evaluated a sample of buildings in this range, and a large percentage were secondary buildings. Detached garages mostly, some additional dwelling units (ADUs), maybe a large shed or two. So, bump/dip explained (I hope you weren’t losing sleep over that).
There’s so much data in this Microsoft building set, I think I’ll do one more post on it. But that’s it, I promise.

One thought on “The Averagest Building in California”