Let’s talk about education. The US Census’ American Community Survey (ACS) provides lots of data about education attainment. The most detailed survey categorizes seven levels of education:
- Less than 9th grade
- 9th to 12th grade, no diploma
- High school graduate (includes equivalency)
- Some college, no degree
- Associate’s degree
- Bachelor’s degree
- Graduate or professional degree
I’ve created a simple metric for identifying the education level of a region. Points are assigned for each step up this hierarchy, and then an average is determined and normalized to a scale of 0 to 100.1For each adult (25 years and older), 0 points for the first category (“less than 9th grade”), 1 point for the second, and so on up to six points for a graduate degree. Then divide by the adult population x 6 (the highest point total). So, for example, if everyone in a area had a less than 9th grade education, its score would be zero; if everyone had a graduate degree, the score would be 100.
As an example, let’s look at California. Here is the distribution of the 26,909,869 adults (25 and over) who live there:
| Less than 9th grade | 2,380,657 | 8.8% |
| 9th to 12th grade, no diploma | 1,804,222 | 6.7% |
| High school graduate (includes equivalency) | 5,578,997 | 20.7% |
| Some college, no degree | 5,287,901 | 19.7% |
| Associate’s degree | 2,120,275 | 7.9% |
| Bachelor’s degree | 5,958,030 | 22.1% |
| Graduate or professional degree | 3,779,787 | 14.0% |
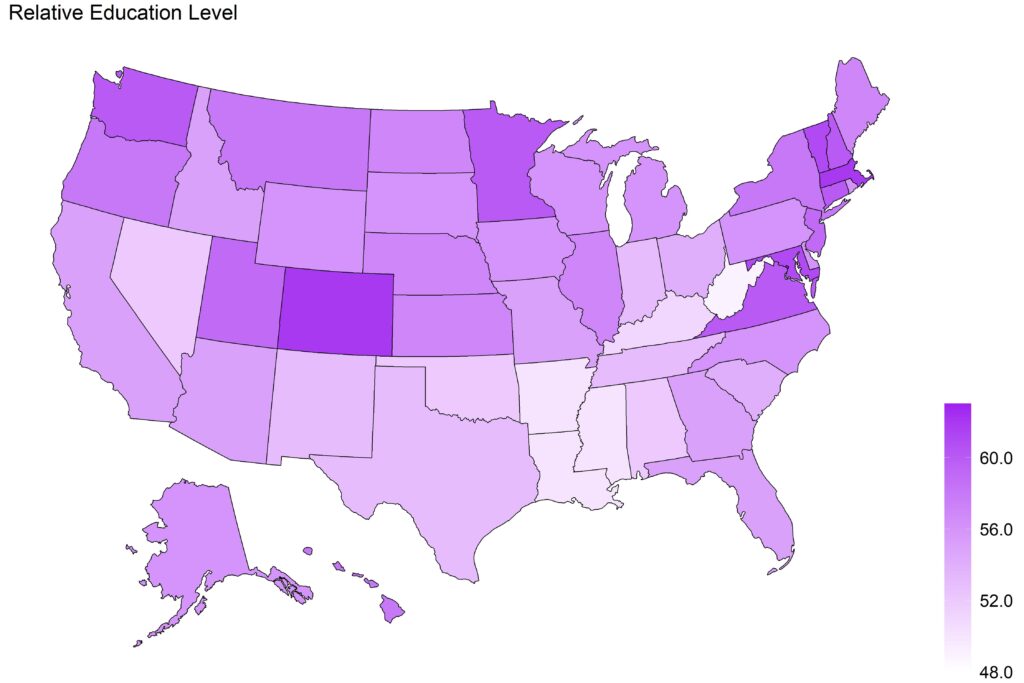
This results in a score of 55, which is close to the average for the country as a whole. Here’s a view of the education level of each state in the US:

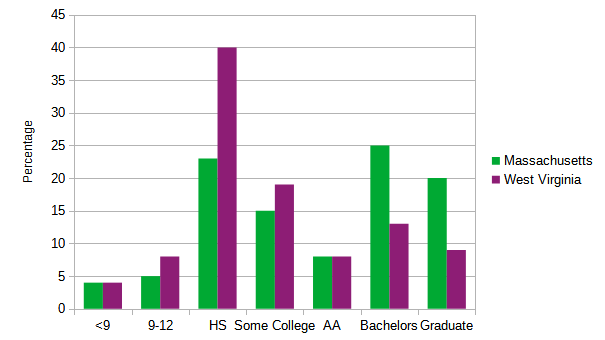
The states range from a high of 62 (Massachusetts) to a low of 49 (West Virginia). That really isn’t a big range; no state is hyper-educated or completely uneducated. Let’s look at the two states at the extremes:

Basically, the difference between them is that a chunk of “High School only” people in WV that went on to get college degrees in MA. Interestingly, the other categories are pretty much even.
We really start to see differences when we look at a more granular level. Let’s break it down at the Census Tract level, which are neighborhoods that average 4000 people (typically between 1,200 and 8,000). Here is a map of California’s census tracts; each is colored by the education score (darker is higher). If you zoom in and click on a tract, you’ll get its details.
In California, the education difference between tracts can be enormous. The extremes are represented by tract 5115.02 in Santa Clara county (education score 95), and tract 456.18 in the Coachella Valley between the Salton Sea and Palm Springs (education score 4). The former is a tony neighborhood adjacent to Stanford University, packed with professors. 79% of the adults who live here have post-graduate degrees. The later is in the middle of a desert farming community, and basically consists of immigrant farm workers, 95% of whom have not graduated high school. The full range of socio-economic status is on display with these two census tracts.
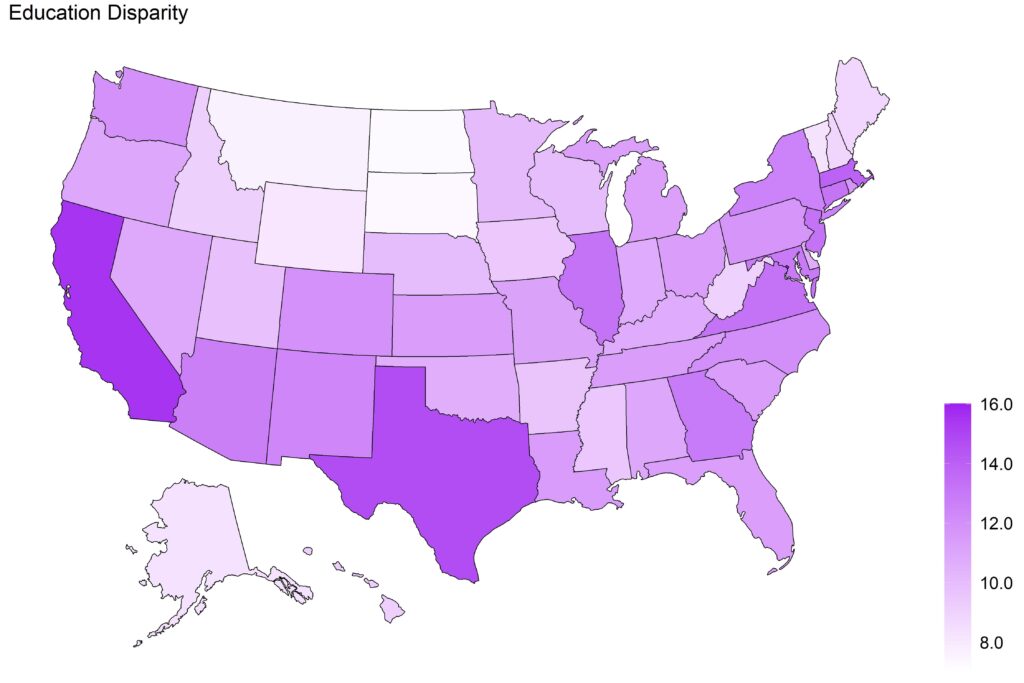
It turns out these two data points are indicative of California’s wide disparity in education levels. We can quantify this be calculating the standard deviation (SD) of the education scores of all of the census tracts in a state. The larger the SD, the more variation in education status from tract to tract. If there was a state where each neighborhood had the same education level, its SD would be zero. The higher the SD, the greater the education disparity is.
California has a particularly large SD, ranking last in education disparity. Here’s what the country looks like:

California’s disparity is not surprising. At the high end, it has dozens of top colleges and universities; neighborhoods near these institutions will tend to be have lots of highly-educated citizens. On the other end, California has a huge agricultural industry, supported by a large immigrant population. Immigrants who came to this country to do farm and other manual labor are typically not going to be highly educated. In California, there are plenty of census tracts at both the high and low end of the scale, leading to the high disparity.
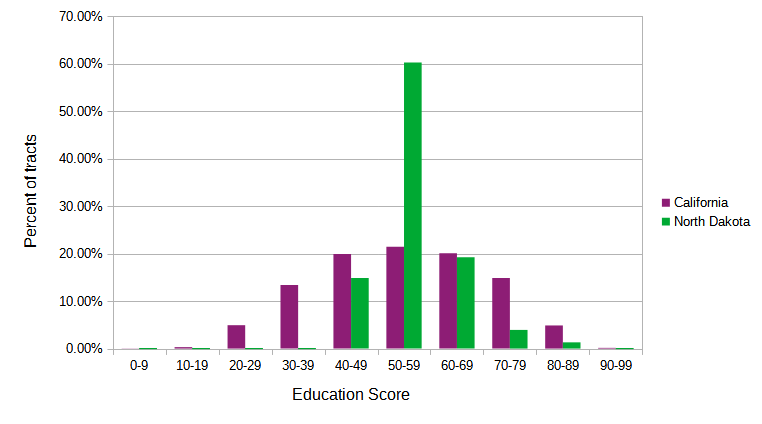
We can contrast that to the lest disparate state, North Dakota. The two states have similar overall education scores: California’s is 55 and North Dakota’s is 57. But the distribution of these scores is quite different. Here’s the census tract view of North Dakota, using the same scale as California.
Everything’s the same hue, huh? The vast majority of North Dakota tracts have a similar profile: close to the average education. Educationally, it’s a homogeneous state – most of the neighborhoods have a similar baseline education. And the baseline is pretty high: no census tracts in North Dakota have an education score below 40 (in California, nearly 20% of them do). This chart shows that distribution difference.

None of this should be shocking. California is a massively diverse state, full of extremes. Why shouldn’t education be among them? North Dakota may not be the most homogeneous state, but I’m pretty sure it’s up there.2Hmm, a metric to determine the most homogeneous state, combining multiple factors. I may have to look into that…
