My friend Paul, who lives in Kalispell, Montana, introduced me to the concept of a “tall thermometer”. This represents the difference between the high and low temperature on a given day. So if the overnight low is 50, and the high that day is 70, your thermometer is 20 degrees ‘tall’.
What happens when you combine the concept of a Tall Thermometer with the historic data from over 5700 weather stations across the US? You get today’s post.
What Paul was noticing was the difference, during summer, between San Diego (where he grew up) and Montana. Summers in Kalispell have a tall thermometer – hot days, cool nights. On average, the tallest day is July 31st, with a high of 84 and low of 50 (thus the thermometer is 34 degrees ‘tall’). Conversely, summers in San Diego have a short thermometer – the nadir reached on June 7th, with a high a 70 and a low of 61, only 11 degrees difference.
There are a couple of different ways of measuring how tall a thermometer is. One is to find the day of the year where the difference between high and low is the greatest (you can likewise find the day of the year where the thermometer is shortest). Or, you can average out the ‘tallness’ of the thermometer over the course of the whole year.
Let’s look at the maximum and minimum ‘tallness’ numbers first. Summer is Kalispell is ‘tall’ season, with the aforementioned July 31st coming in at 34 degrees. But by the time late fall comes around, the thermometer has shortened to 12 degrees (November 30th, high = 35, low = 23).
As previously mentioned, San Diego’s summers have short thermometers. The tallest San Diego gets is November 29th, at 18 degrees (69 high, 51 low). It’s interesting that San Diego’s tallest tall happens almost exactly the same day as Kalispell’s shortest tall.
How do these rank against the other 5600 weather stations across the US? Glad you asked. Here are the tallest thermometers:
| Location | Tallness | High | Low | Date |
| Fort Rock, OR | 52° | 88° | 36° | August 8 |
| Lowman, ID | 50° | 90° | 50° | August 7 |
| Boca, CA | 49° | 86° | 37° | August 3 |
| Deeth, NV | 49° | 85° | 36° | August 29 |
| Hat Creek, CA | 49° | 93° | 44° | August 12 |
Geographically, all of these are pretty much the same: inland & high altitude (4000-5000 feet), relatively arid. Loosely described as ‘high desert’. At these places, sometime in August the low approaches freezing, and the high gets into the 80s.
What about year-round Tallness? The award for that goes a similar locale: Reserve, New Mexico. The difference between its high and low ranges from 32-47 degrees, with an average of 40.
At the other end of the spectrum are the places that have short thermometers. Most of the ones on this list are in Alaska. The winner is Eareckson Air Station, way out on the Aleutian Islands. Typically the high temp is just five degrees more than the low; the most exciting time of year is when it goes up by seven whole degrees (October 13: low is 39, high is 46). There are dozens more weather stations similar to that in Alaska. The state’s new slogan: It May Be Cold During the Day, But It Doesn’t Get Much Colder At Night.
If we skip over all of the Alaska stations, the top of the non-tall thermometer list includes: Kaneohe Bay, Hawaii; Key West, Florida; Miami, Florida; and Galveston, Texas. All with with a yearly “tallness” average of about 10 degrees. Fairly high on the list (at #35 of 5700 stations) is…North Island Air Station, in Coronado, near my home town. Typically just 12 degrees difference between the high and low.
Next, let’s look at consistency. Which locations have similar tallness all year around, regardless of the actual height of the thermometer?1To determine ‘tallness consistency’, I calculate the standard deviation of the tallness for each day of the year Not surprisingly, the locations that top the list are all in Hawaii.
| Location | Largest Tall | Smallest Tall | Average Tall | SD |
| Lahaina, HI | 20 (87 H – 67 L) | 17 (81 H – 64 L) | 18.5 | 0.43 |
| Honolulu, HI | 15 (80 H – 65 L) | 12 (81 H – 79 L) | 13.5 | 0.46 |
| Hilo, HI | 16 (79 H – 63 L) | 14 (82 H – 68 L) | 15 | 0.49 |
| Ookala, HI | 14 (77 H – 63 L) | 11 (78 H – 67 L) | 12.5 | 0.50 |
The ‘talls’ are pretty consistent for each location. Note that the high and low temperatures don’t change much either. Basically, the temps are pretty consistent in Hawaii all year around.
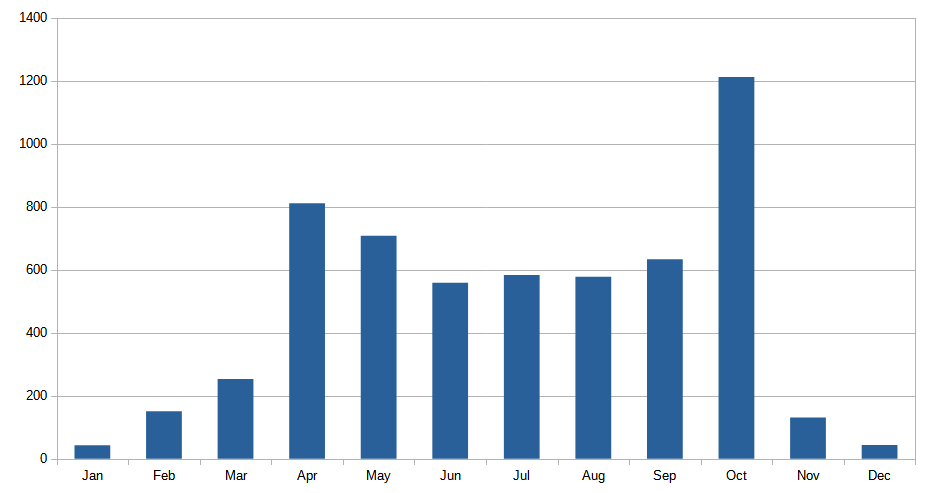
Finally, let’s talk about when tall thermometers happen. At each location, one day of the year has the tallest thermometer. Here’s how those days are distributed, by month:

Tall thermometers can happen any time of year, but more often in summer and early fall. Of course, when they happen depends a lot on where they happen. Here’s a video that shows the location of the tallest thermometers, month-by-month:
It’s pretty clear that maximum tallness is dependent on region and the time of year. I’m not a weather expert, so I can’t explain why the tallness moves around. But it’s kind of cool to watch.
