I haven’t written about Covid-19, because lots of very smart people are already doing great analysis of it. (Of course, there’s also been a lot of crappy analysis too, usually by someone with a political ax to grind). But…
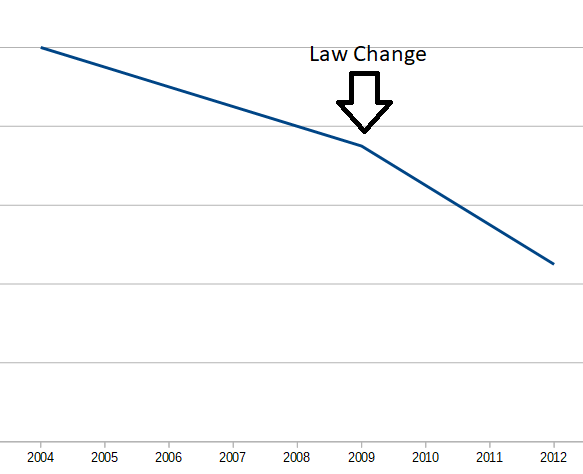
One thing that struck me recently, is that we’re about to embark on a large multiple interrupted time series study. An Interrupted Time Series is a quasi-experiment that looks a trends both before and after an event, to see if the event correlates (and may have caused) a change to the trend. For example (and this is totally made up), assume California changed their drunk driving laws on January 1, 2009. By plotting the drunk driving deaths both before and after the change, you might be able to see if the law made a difference. It’s important to look at the trend (over several years, in this example) both before and after the event. You can’t just say “drunk driving deaths dropped in 2009, therefore the law worked”, because maybe they were already dropping. Here’s our made-up example:

In this case, the law seems to have made a difference. Even though drunk driving deaths were already dropping, the pace accelerated after the law change.
But, correlation is not causation. All we know for sure is that drunk driving death rates decelerated in 2009. Perhaps something else happened in 2009 that contributed to the decline (known as a confounding event). For example, in 2009 a recession started that lasted for a few years. In a recession, people drive less, which would result in fewer drunk driving deaths. Or, maybe there was a societal change in attitude on drunk driving. Or a new safety feature in automobiles. While this one data point would be evidence of the (imaginary) law’s success, it isn’t proof. You have to eliminate confounding events.
That’s where a Multiple Interrupted Time Series comes in. If different states enacted drunk driving laws at different times, then you’d have a bunch of different graphs, where the “law change” point is different for each. If Arizona changed their law in 2012, and Oregon in 2004, and both saw the same drop, you could pretty much eliminate “recession” as a confounding event – there wasn’t a recession in those years. If you have enough Interrupted Time Series, with different event points, you can do a lot toward eliminating confounding events.
Anyway, back to Covid-19. We’re about to embark on a grand Multiple Interrupted Time Series experiment. Different states will be relaxing their social-contact restrictions, at different times, in different stages. So we’ll have a lot of Interrupted Time Series graphs, at many different time points. A careful study may be able to figure out the effect of these changes, avoiding confounding events. It will be an extremely tricky analysis, but eventually some good information should come out of it.
