I’m back to looking at presidential voting patterns. In February I looked at how closely states and counties match the country’s voting results. This post will look a different question: the consistency of states and counties. Specifically, how consistent is a region’s party lean, when compared to the nation as a whole?
As an example, let’s look at South Carolina. Here’s their voting over the past six elections:
| 1996 | 2000 | 2004 | 2008 | 2012 | 2016 | |
| SC | R+6.0 | R+15.9 | R+17.8 | R+9.0 | R+10.5 | R+14.3 |
A solid Republican state, but at first glance it doesn’t look that consistent, with a lean toward R ranging from 6 to 18 points.
But we need to adjust for the behavior of the country as a whole. If the whole country leans more Republican in a given election, you’d expect a consistent state to do the same (relative to their baseline). Likewise, in a Democratic year you might expect them to move in that direction. Let’s adjust for the national vote:
| 1996 | 2000 | 2004 | 2008 | 2012 | 2016 | |
| SC | R+6.0 | R+15.9 | R+17.8 | R+9.0 | R+10.5 | R+14.3 |
| USA | D+8.5 | D+0.5 | R+2.5 | D+7.3 | D+3.9 | D+2.1 |
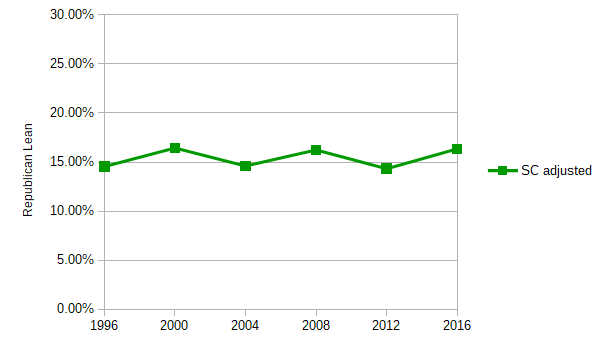
| SC adj. lean (+R) | 14.6 | 16.5 | 14.6 | 16.3 | 14.3 | 16.4 |
The last row is the “adjusted lean”: how much more South Carolina voted toward Republican, compared to the country as a whole. For example, in 2008, the US voted D+7.3, while South Carolina voted R+9.0, so they were 16.3 points more Republican than the country. With this adjustment, you see that the state is very consistent: always 14-16 points more Republican than the rest of the country:
South Carolina is, in fact, the most consistent state over this time period.
[Notes: 1) Consistency is measured as the standard deviation of the differences from the national vote. 2) The ‘SC adj. lean’ column values may sometimes look off by a tenth of a percent, but this is due to rounding. They are accurate.]
The top five ‘consistent’ states are:
| Standard Deviation | |
| South Carolina | 0.9 |
| Florida | 1.2 |
| Kansas | 1.9 |
| New York | 2.0 |
| New Hampshire | 2.1 |
Again, consistency does not necessarily mean middle-of-the-road. On this list you have couple of strong Republican states (SC and Kansas), a strong Democratic one (New York), and a couple that could go either way (Florida, New Hampshire).
At the county level, here are the two most consistent:
| Lean | 1996 | 2000 | 2004 | 2008 | 2012 | 2016 |
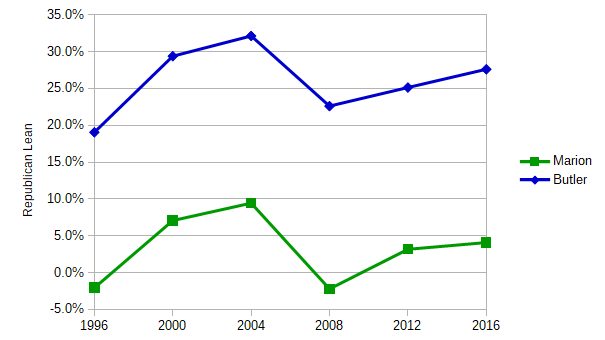
| Marion, OR | D+2.1 | R+7.1 | R+9.4 | D+2.2 | R+3.2 | R+4.1 |
| Butler, OH | R+19.1 | R+29.4 | R+32.1 | R+22.6 | R+25.1 | R+27.6 |
At first glance, these counties don’t look particularly consistent. Marion went Democratic a couple of times, but also includes some strong R years. Butler is solidly Republican, but the margin varies from 19 to 32 points:
But when we adjust for how the nation voted as a whole:
| Adjusted Lean | 1996 | 2000 | 2004 | 2008 | 2012 | 2016 |
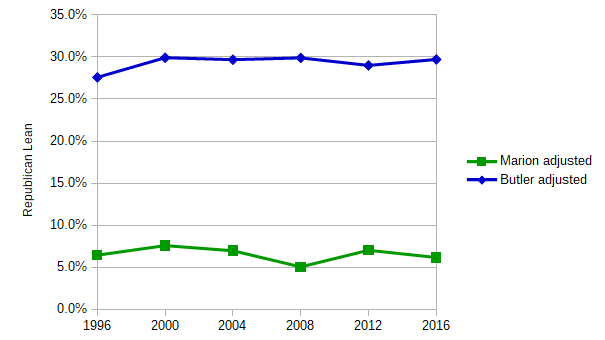
| Marion, OR | R+6.5 | R+7.6 | R+7.0 | R+5.1 | R+7.0 | R+6.2 |
| Butler, OH | R+27.6 | R+29.9 | R+29.7 | R+29.9 | R+29.0 | R+29.7 |
The Adjusted Lean makes it clear that, in any given election, Marion leans around 6-7 points towards R (that is, 6-7 points more R than the rest of the country), and Butler leans about 29 points in the same direction.
What about the other end of the spectrum: states and counties that are not consistent? There certainly are examples of this, where there are wide differences in the results over the past six elections. But almost all of them represent areas that are undergoing a transition from one party to another. And it’s almost always a southern state, going from Democratic to Republican. A poster child for this is West Virginia:
| 1996 | 2000 | 2004 | 2008 | 2012 | 2016 | |
| Lean | D+14.8 | R+6.3 | R+12.9 | R+13.1 | R+26.8 | R+41.9 |
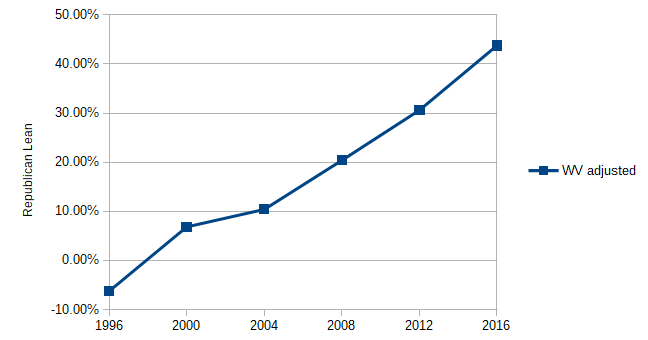
| Adjusted Lean | D+6.2 | R+6.8 | R+10.4 | R+20.4 | R+30.6 | R+43.8 |
Basically, Republicans have picked up 10 points in this state in each of the past five elections. The same pattern holds true for several other southern states.
In one sense, these states aren’t consistent: over the past several elections, their lean has changed dramatically. However, in another sense, they are perfectly consistent, with a nice even slope toward R:
At the county level, it’s the same: counties in southern states that are transitioning from D to R. And it’s even more extreme. Knott County, Kentucky, has gone from D+55 to R+54 in just six elections:
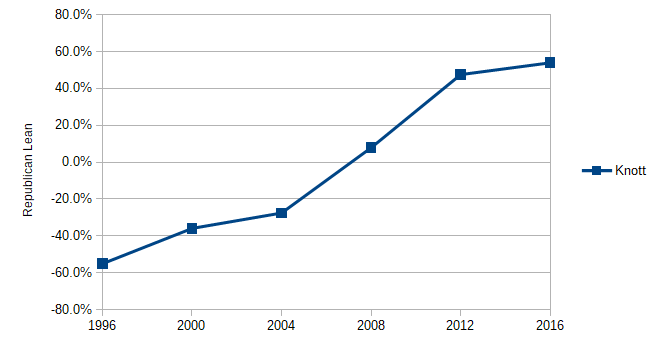
That means that effectively half the voters in this county have switched from D to R in the past 20 years. Whew!
Finally, are there any “true” inconsistent states or counties, that jumped around between D and R with no rhyme or reason? Not really. At first glance Utah’s behavior looks strange:
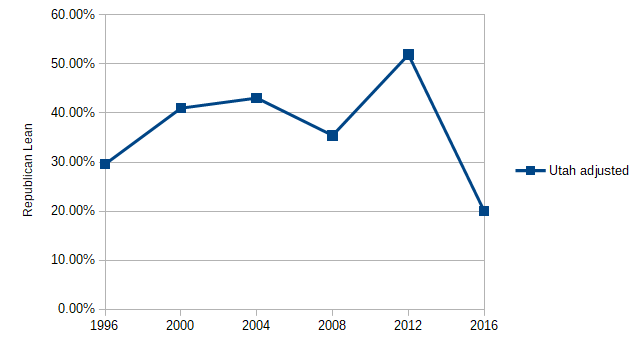
But there is an explanation. Always a conservative state, it jumped extra far toward R on 2012 (voting for favorite son Mitt Romney). Then, in 2016, a strong “never Trump” movement siphoned votes from the R side to a 3rd party candidate (Utah’s Evan McMullin). That explains the jump and dip in the past two elections.
