The NFIRS data lists several time stamps for each incident. One is when the alarm was received at the fire station. A second is when the fire company arrived on the scene. The difference between these two is the response time: how quickly the fire company responded to the alarm.
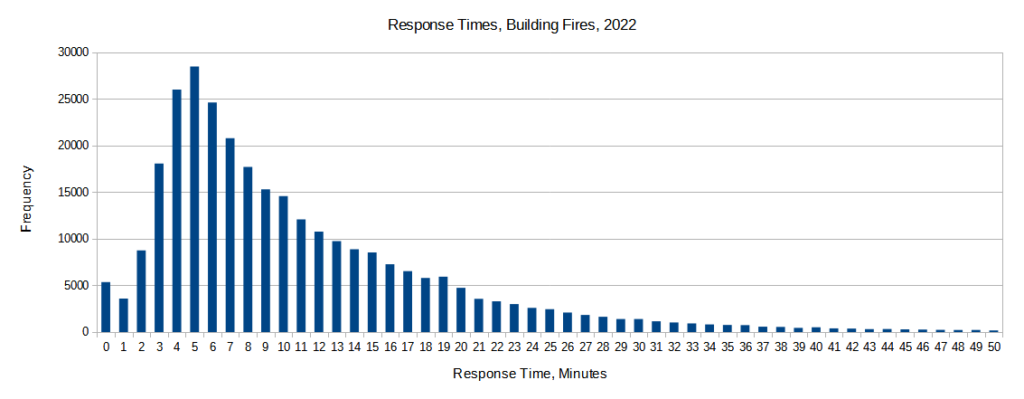
To make sure we’re doing an apples-to-apples comparison, I’ll look at the response times for a specific fire type. I’ll use building fires, the most common type. Across the nation, the average (mean) response time for building fires is 11.3 minutes. The midpoint (median) is 8 minutes. Here’s a plot of response time frequency:

Summarizing:
- The most common response time to building fires is 5 minutes
- The median response time is 8 minutes
- The average is 11.3 minutes.
The fact that the most common, median, and average values are all different is typical when the distribution graph asymmetrical, with a long long tail on one end. The values on the right end of the curve “pull” the median and (especially) the average higher.
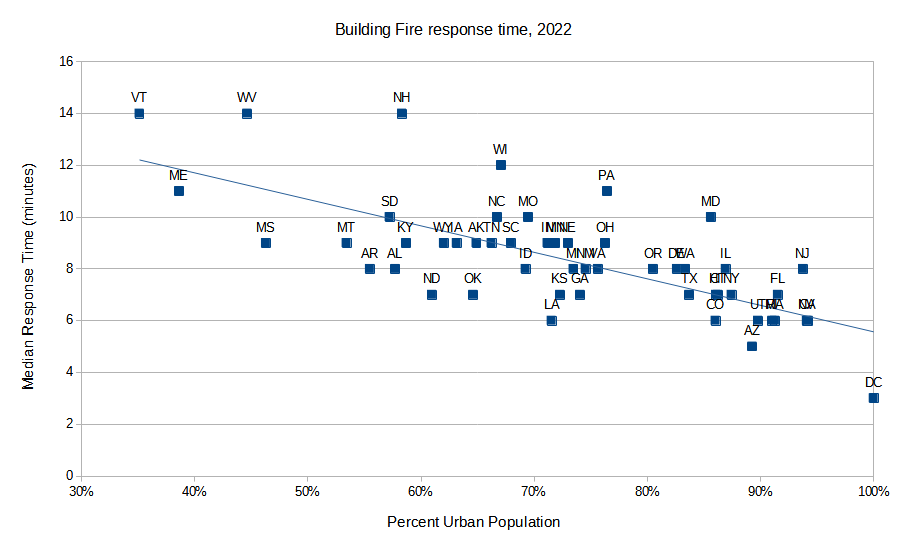
At the state level, a pattern starts to emerge: urban states have faster response time averages than rural states. Here’s a graph of all 51 states (including Washington, D.C.), plotting response time versus how urban the state is:

There’s definitely a correlation between urban-ness and quicker response time. That makes sense: typically, an urban fire company has less distance to travel to a fire incident than a rural one. Correlation is evidence, not proof; let’s dig deeper and make sure. Each fire incident has an associated address. The Census Geocoder allows me to map each of those addresses to a specific point on the map, down to the Census Block. And, the Census data classifies each Block as urban or rural. Thus, we can categorize each specific building fire as occurring in either an urban or rural locale.1At least, for the 87% of fire incidents where the address lookup succeeds. Lookup failure is typically due to a typo or obscure location (e.g., “mile marker 3 on Hwy 17”). But that still leaves 260,000 building fires to analyze. Here are the results:
| Response Times, building fires | Urban | Rural |
| Median | 6 minutes | 13 minutes |
| Average | 8.3 minutes | 15.5 minutes |
So urban response is about twice as fast as rural. That there is a difference between the two is not surprising; the magnitude of it is, at least to me.
Here are the response times for the 15 most populous cities in the US:
| City | Average Response Time (minutes), building fire, 2002 |
| New York | 3.9 |
| Los Angeles | 4.5 |
| Chicago | 3.4 |
| Houston | 7.1 |
| Phoenix | 4.3 |
| Philadelphia | 2.8 |
| San Antonio | 6.0 |
| San Diego | 5.3 |
| Dallas | 5.1 |
| Jacksonville | 4.4 |
| Fort Worth | 12.0 |
| Austin | 5.8 |
| San Jose | 4.9 |
| Charlotte | 8.7 |
| Columbus | 4.6 |
One of these things is not like the others: Fort Worth’s average response time is 40% worse than the next closest city (Charlotte), and 2.3 times worse than the average of the other large cities. And it wasn’t just a fluke year: Fort Worth ranked near the bottom in 2021 and 2020 as well. Not sure why; it’s a quickly-growing city272% over the past two decades, maybe their services aren’t keeping up with that growth.
There is a third timestamp in the incident report: the time at which the incident was “controlled”. Basically, when the firefighters were done with the active fire (they probably remained on site for a while for cleanup, etc.). Subtracting the Controlled time from the Arrival time determines how long they took to actually fight the fire. Across all 50 states, the answer is 74 minutes (median) or 103 minutes (average), for building fires. Here’s the breakdown:
| Time to Control Building Fire | Median | Average |
| All locations | 74 | 103 |
| Urban | 68 | 97 |
| Rural | 86 | 112 |
That’s right, not only does it take longer for rural fire companies to travel to a building fire, it takes them longer to put it out once they get there. Maybe the former causes the later – the longer it takes you to get to a fire, the more it spreads, and therefore the longer it’ll take you to put it out. There are other possible explanations (e.g., the characteristics of rural vs. urban buildings).
Do these delays mean that rural building fires are more dangerous? No, as it turns out:
| Injuries per 1000 fires | Deaths per 1000 fires | |
| Urban | 21.7 | 5.8 |
| Rural | 6.7 | 5.5 |
Urban building fires are slightly more dangerous when it comes to deaths, and three times more dangerous when it comes to injuries. Presumably due to the difference in design of urban and rural dwellings (e.g., closely-packed houses and apartments versus spread out country homes). Any advantage urban dwellers have from the speediness of fire station response is dwarfed by the fact that urban homes have, on the whole, some set of characteristics that make their fires more dangerous.
