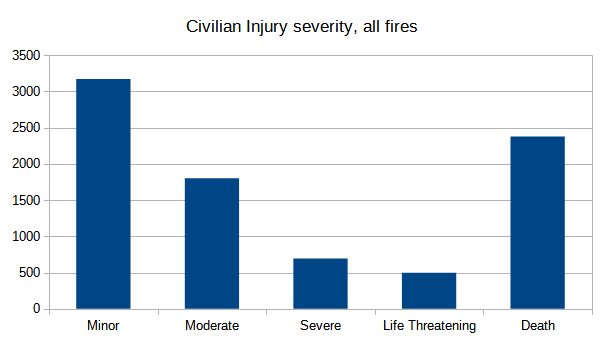
Not the happiest subject today – I’m looking at the casualty numbers from the NFIRS reports. In 2022, the data reports 8763 civilian casualties (6384 injuries and 2379 deaths) in all fires1Because not all fire departments contribute to the FIRS reports, the totals here do not represent the true numbers of fire casualties. These numbers are scaled up and combined with other data to generate estimates of the actual counts.. Here’s a chart that shows the severity of fire-related injuries to civilians in 2022

The good news is, the most common injury in a fire is “minor” (the patient is not in danger and immediate medical care is not necessary). The bad news is, the second most common injury in a fire is death. Yikes. Make sure your smoke alarms are working.
Let’s look at the casualty rates for different categories of fires:
| Fire Type | Injuries per 1000 fires | Deaths per 1000 fires |
| Building Fire | 15.0 | 5.4 |
| Mobile Property | 16.0 | 10.5 |
| Vehicle | 3.4 | 3.1 |
| Natural Vegetation | 0.5 | 0.1 |
| Outside Rubbish | 0.5 | 0.1 |
| Crop | 0.7 | 0.0 |
| Outside, other | 4.0 | 0.6 |
Mobile homes are less fire-safe than regular homes – slightly more injuries, and twice as many deaths (per fire). Probable causes: lower construction standards, cramped conditions (fires spread faster, and it’s harder to evacuate), and mobile home parks often have difficult access for firefighters.
I talked about vehicle fires last time, but I didn’t mention how deadly they were – just under half of the injuries in car fires are deaths.
Outside fires (rubbish, natural vegetation, crops) are generally safer for civilians, which makes sense: people are less likely to be trapped when outside. The exception is in the “other” category, a subcategory called “Outside gas or vapor combustion explosion”. These are equipment explosions that don’t result in a sustained fire. Luckily they are relatively rare (just 0.06% of all fires), because when they do happen, they are dangerous. 63 injuries per 1000 incidents, which is four times the rate of building fires. By far the most common cause is uncontained ignition of flammable liquid or gas. The reports generally don’t list the type of equipment, but for those that do the most common is “barbecue grill”. And 20% of those result in injuries. Be careful with your propane grill!
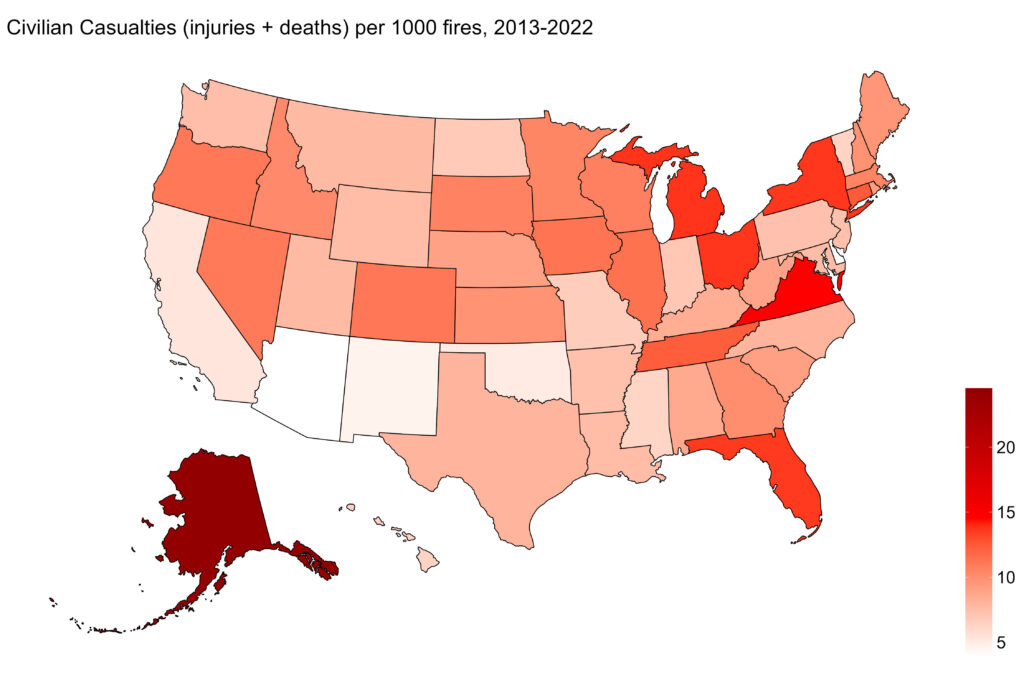
Looking at overall fire casualties, let’s break things down at the state level. I’ll use 10 years of fire data (2013-2022) to smooth things out a bit. Here are the civilian casualty rates by state:

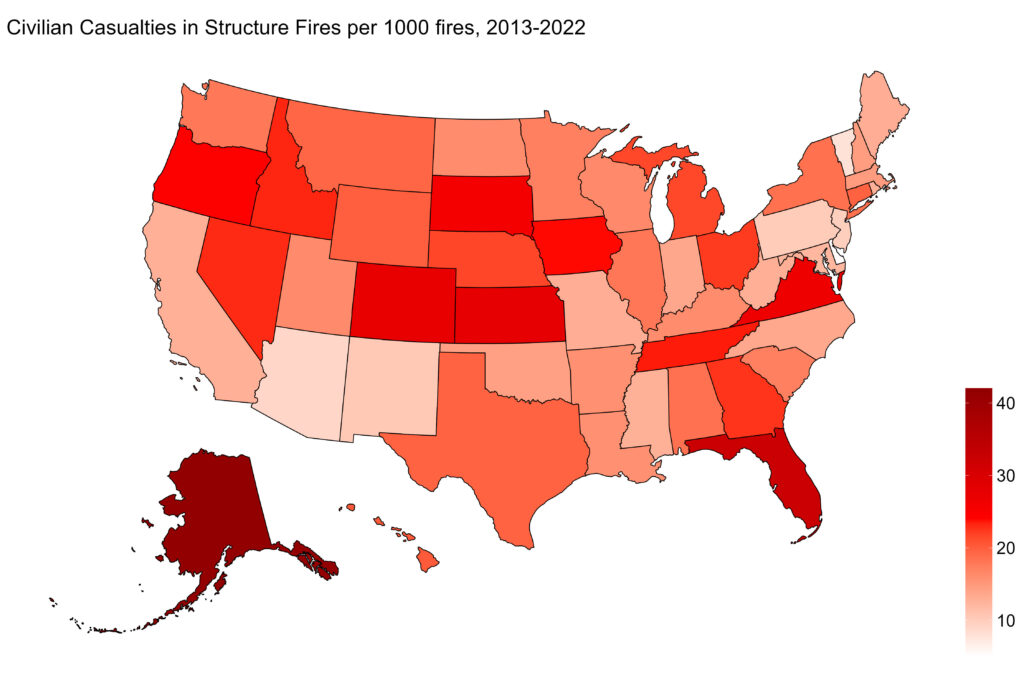
Alaska stands way beyond all other states, with over 24 casualties per 1000 fires. This is 2.5 times greater than the national average. But, I need to be careful: different states have different distribution of fire types – some states have a lot more outdoor/rubbish fires, which have a much lower casualty rate. That could be influencing these numbers. So let’s redo this map, this time focusing only on Structure fires:

Alaska still leads the way, but Florida isn’t too far behind. Alaska has some unique characteristics that all probably contribute to its high casualty rate: vast size, extreme weather, spread out rural areas, individualist credo. Not sure what’s up with Florida (insert snark here). After that, it’s hard to see much of a pattern.
Finally, a brief note about firefighter casualties. Per fire, firefighters are slightly more likely to be injured than civilians (6.1 per 1000 fires, versus 5.1). But they are 100 times less likely to die. It’s a risky profession, but no where near risky as having a fire in your house.
