This time I’ll look at census respondents who specified Black when asked about their race and origin. There are two categories of responses here: those who listed “African American” as their origin, and those who indicated something more specific (a country, typically sub-Saharan Africa or the Caribbean).
The former group makes up about 90% of the Black responses. This is a legacy of slavery – a majority of Black Americans cannot identify their ethnic origin in any more detail than “Black” or “African American”, simply because those details are lost to history (Although it’s possible that genetic testing can help get past the “wall of slavery“.)
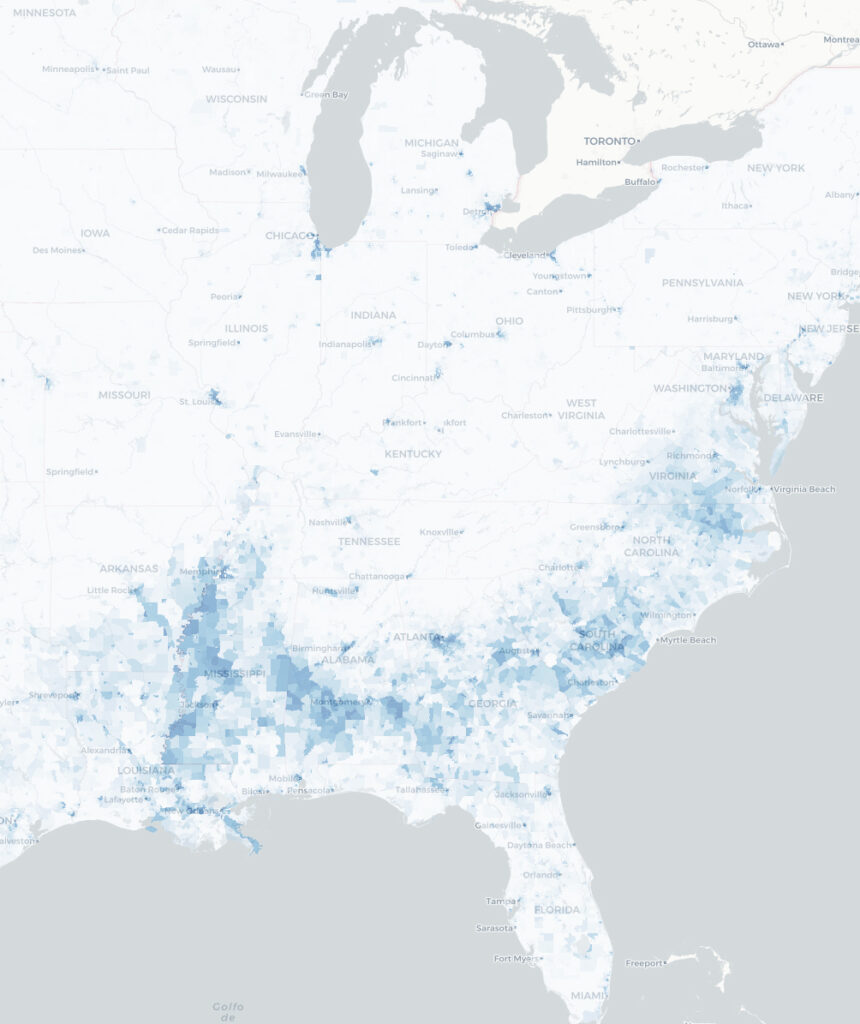
I’ll discuss this origin first. There are 17 census tracts that are 100% African American, and dozens more that are nearly 100%. There are 6000 census tracts that are at least 50% African American, a large majority in the southern states. Here’s a map of the eastern part of the US, highlighting tracts that have high concentrations of African Americans:

Most of the tracts are in the south, including many rural communities. In the north, African American neighborhoods are concentrated in big cities like Chicago and Detroit, a consequence of the Great Migration.
Now we’ll proceed with the other Black heritages, those based on a specific country of origin. As with previous pages, the census tract with the highest concentration of each heritage is listed.
| Heritage | Tract | County | State | Pct | National |
| Somali | 1048.01 | Hennepin | Minnesota | 62.6% | 0.07% |
Minneapolis became a focal point for immigration from Somalia in the early 1990s. Interestingly, this census tract is something of an outlier – it’s dramatically more concentrated than the next one on the list, by 25 percentage points (62.6% vs. 37.3%). Typically, the difference between the first and second most concentrated tracts for a given heritage is less than a percentage point (for example, the top two tracts for Chinese heritage are 88.8% and 88.0%). But this Somali neighborhood is substantially more dense than any other in the country. It’s unclear why this is the case.
| Heritage | Tract | County | State | Pct | National |
| Haitian | 2.18 | Miami-Dade | Florida | 53.8% | 0.31% |
| Jamaican | 5.02 | Jefferson | Arkansas | 37.4% | 0.32% |
Jamaicans in Pine Bluff, Arkansas? Turns out that this tract represents the campus of the University of Arkansas at Pine Bluff, a Historically Black University with a lot of international students from Jamaica. Presumably a bunch of them live on campus or close nearby; it’s the only census tract in the area with any Jamaican population. The “true” center of Jamaican heritage in the US a grouping of about 30 tracts in the Bronx/Westchester County part of New York.
| Heritage | Tract | County | State | Pct | National |
| Ethiopian | 2001.05 | Alexandria city | Virginia | 28.3% | 0.1% |
There are several pockets of Ethiopian heritage scattered across the US, with densities in the 20-30% range. And when I say scattered, I mean it: Virginia (Alexandra), Minnesota (Saint Paul), Georgia (outside of Atlanta), Texas (Houston), and Washington (SeaTac area). There is no dominant Ethiopian enclave in the US.
Next time, I’ll wrap up with the Native Hawaiian/Pacific Islander group, and the Other category.
