Let me lead off with a correction of my previous post. It turns out that the restaurant dataset has some flaws with respect to the “fast food” cuisine. Many fast food restaurants were not labeled as such; even McDonald’s or Burger King were often labeled with the “Restaurant” or “American” cuisine, but not “Fast Food”. Not sure why this happened; perhaps each restaurant self-reported their cuisine? Other types of restaurants were reported correctly; maybe “fast food” is avoided because of its negative connotations.
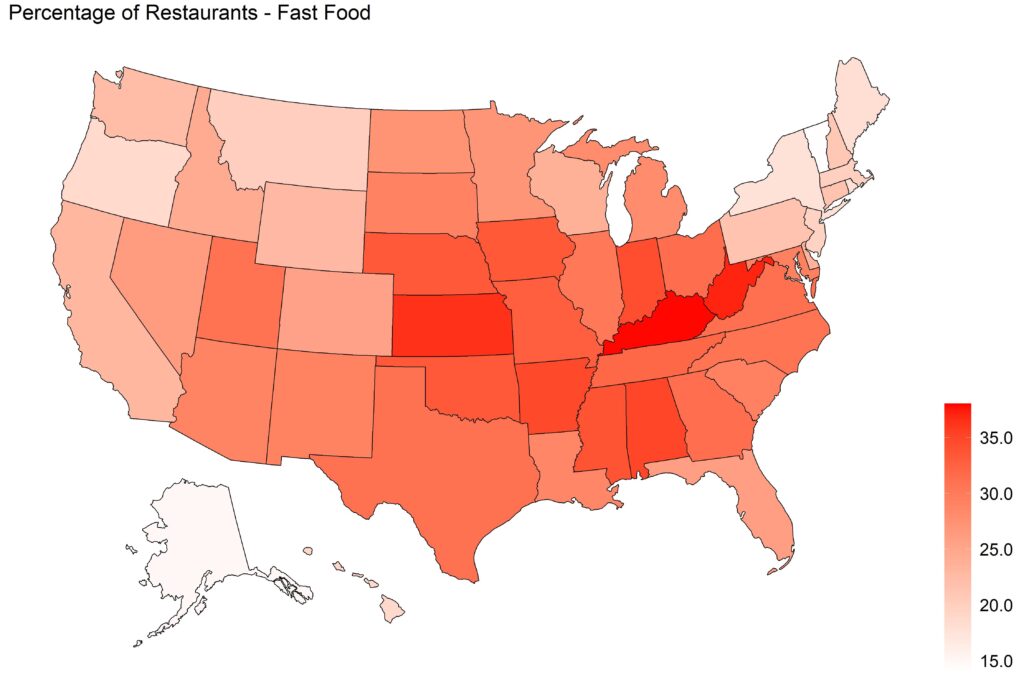
I manually inspected the cuisine of all large chain restaurants, specifying the “Fast Food” cuisine for places there were obviously fast food. Using the new data, here is the relative frequency of fast food restaurants, by state:

The most fast food-saturated state is Kentucky (38% of restaurants are fast food), while the least is Vermont (14%).
Here’s a trivial question for you. The state with the highest proportion of Hawaiian restaurants is Hawaii, obviously (18%). What state is second? Take a guess…<plays Final Jeopardy music>
Now let’s work at a more granular level than states. But how granular? Counties? Counties are okay, but they range in population from huge (LA county has 10 million people) to tiny (some west Texas counties have a couple hundred inhabitants). A better division is the census tract. Census tracts are small, more-or-less permanent subdivisions of a county. Their population averages around 4000 (the range is usually 1800-8000). Physically, they can be quite small; in densely-packed urban areas, they might just be a few blocks. They are a reasonable representation of a neighborhood, for some definition of ‘neighborhood’.
I’ll start with an extreme: the tract has the most restaurants per area. Not surprisingly, it’s in New York. Specifically, this part of the East Village in Manhattan, bordered by 1st and 3rd Avenues, and East 3rd and 9ths Streets. Basically a six by two block area (yes, the two blocks are long) with 188 restaurants (you can hover over each icon to see the restaurant name and cuisine):
This works out to one restaurant per 11,587 square feet. That may not sound like much, but it means that every 108 foot by 108 foot square has a restaurant. Another way of putting it is that it’s 2407 restaurants per square mile. Not lacking for choice!
New York City dominates the top 100 census tracts, ranked by restaurants per area. The top seven are all in Manhattan. The first from another city is this one in San Francisco:
Just west of Union Square, on Geary and Post. 64 restaurants in six blocks – not bad. Another non-New York tract in the top 10 is this one in the North Beach area of Boston:
It sports the highest concentration of Italian restaurants of any tract in the country, by a factor of two over the next highest! San Francisco makes another couple of appearances in the top 50, as does Philadelphia. But really, it’s all New York, New York.
Finally, let’s look at the census tract that has the most large chain restaurants2I’ll define ‘large’ as any chain with at least 50 locations. There are different ways of slicing the data, but I think that the winner is this tract, which basically encompasses The Loop in Chicago:
It’s a large tract (for a city), almost half a square mile. Population around 7500, but I’m sure during a work day there are a lot more people there. It contains 370 restaurants, of which 131 belong to large chains. This one area of Chicago, basically 6 by 10 city blocks, contains 7 McDonald’s, 8 Seven Elevens, 14 Subways, 10 Potbelly Sandwich Shops, 19 Starbucks, and 21 Dunkin’s. Not to mention 4 Chipotle’s, 3 Panda Expresses, 2 Taco Bells, 2 Arby’s, and a Burger King (the BK must feel lonely). I guess if you work in downtown Chicago, you gotta eat lunch.
