[I know there’s lots in the news about record temperatures in Europe, but the timing of this post is unrelated. Global climate change is a far bigger issue than I can study. This is just me playing with some historical weather numbers.]
In my previous post I started digging into the historical climate data for thousands of weather stations across the US. As a reminder, I use weather stations with at least 40 years worth of high/low temperature data. The 40 years don’t have to be recent; a station may have been active in the early part of the 1900s, for example, but as long as it has 40 years of data, it qualifies.
For each station, I found the hottest day of the year: the day that had the highest average high temperature. Let’s look at when these days happen. The hottest day of the year isn’t the same day in each location in the country. Examples: the hottest day in Santa Fe is June 29th; in Philadelphia it’s July 14th, and in Miami it’s August 16th.
The earliest hottest day is June 8th, in Castolon, Texas (along the border with Mexico, near Big Bend). It averages 105 degrees Fahrenheit on June 8th, and it’s never hotter any other day of the year (on the average, of course). There are a few other locations that max out in June, but the vast majority (80%) have their hottest days in July. Another 15% are found in August. There are a few more that occur in September, and the latest is October 22nd in Kainaliu, Hawaii (if you stick to the mainland, the latest is October 13th in San Francisco).
Where do the hottest days occur? Depends on the day. For example, here is June 28th (now looking at mainland stations only; we’ll ignore Alaska and Hawaii because they are so often outliers):
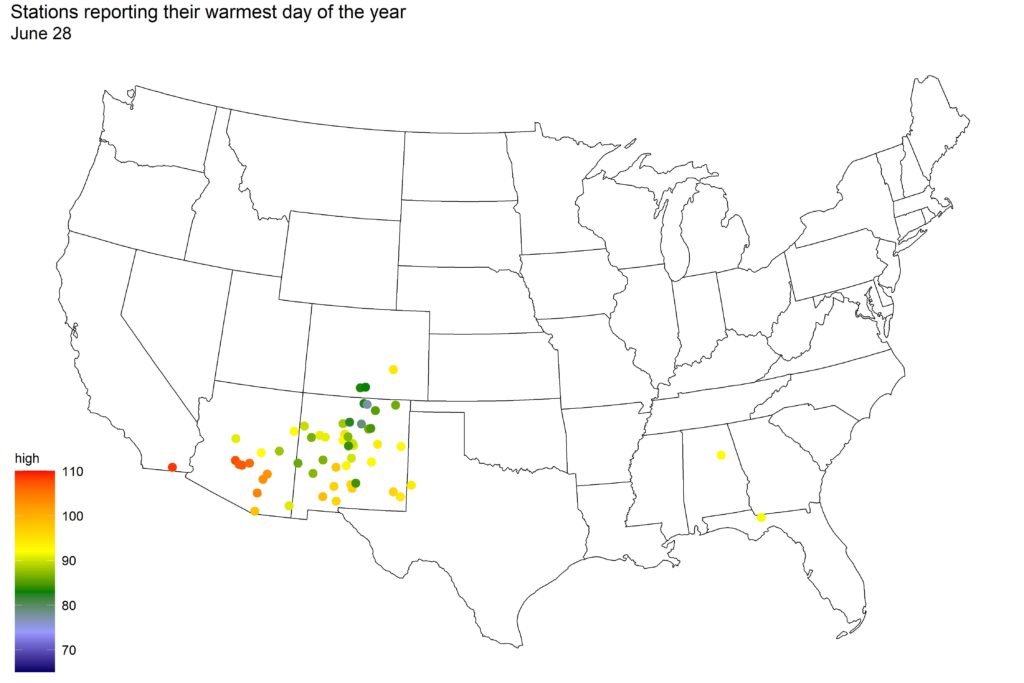
Remember, these are not necessarily the hottest locations on June 28th. Instead, these are the locations where June 28th is the hottest day of year. There may be other locations around the country that were hotter that day, but it wasn’t their maximum.
How about another day, say, July 20th?
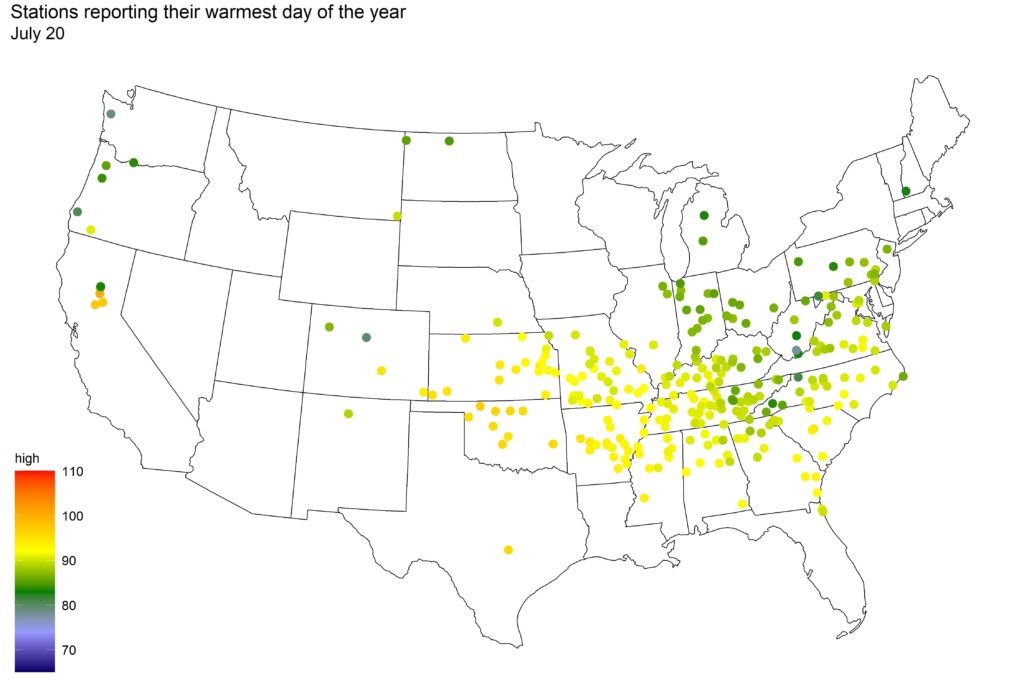
This day, many locations in the “upper south” region hit their yearly highs.
By the time August 7th comes around, it’s time for Texas and other parts of the South:
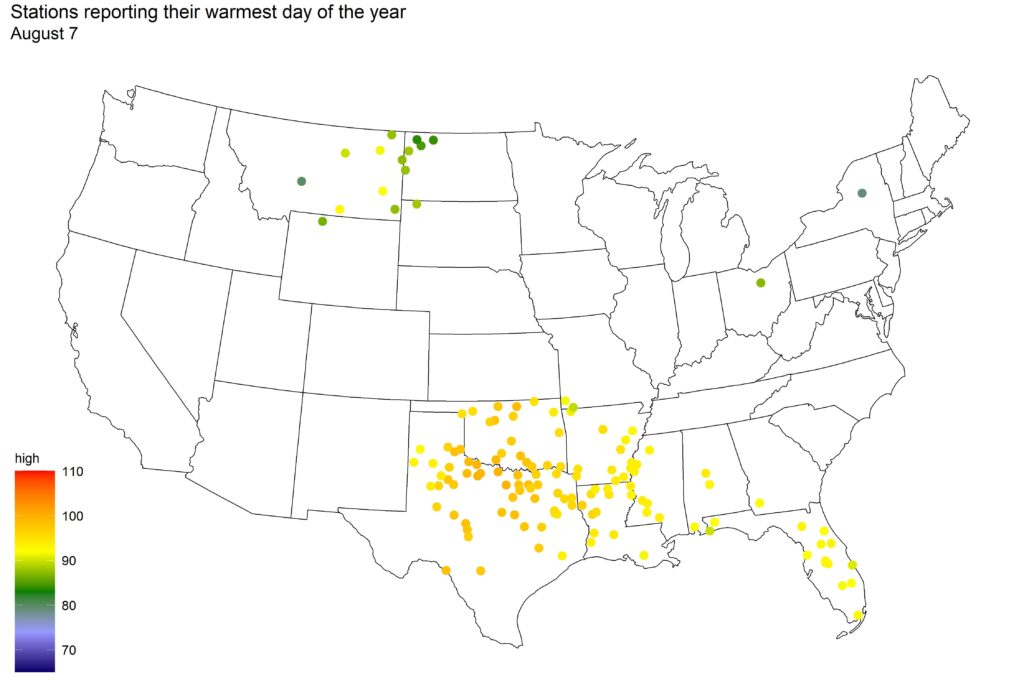
We can string these maps together in chronological order, for a time-based video that shows who is having their hottest day of the year. Note that each station appears on this video only once, on the day of the year where its hottest average high occurs.
At the risk of repeating myself, remember that this map does not show the hottest locations. It shows locations that are experiencing their hottest day of the year. There’s a subtle difference.
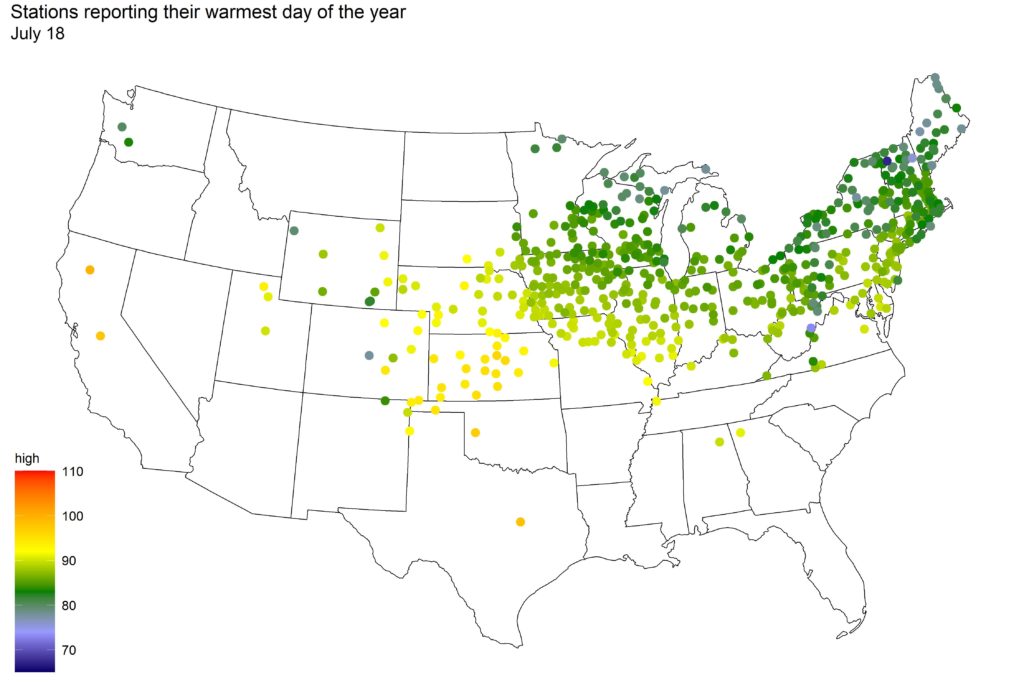
There’s a weirdness in this data that you may have noticed watching the video. As the days progress into summer, the number of weather stations that report their warmest high for the year increases. The peak is reached on July 18th, with 597 stations reporting their yearly high:
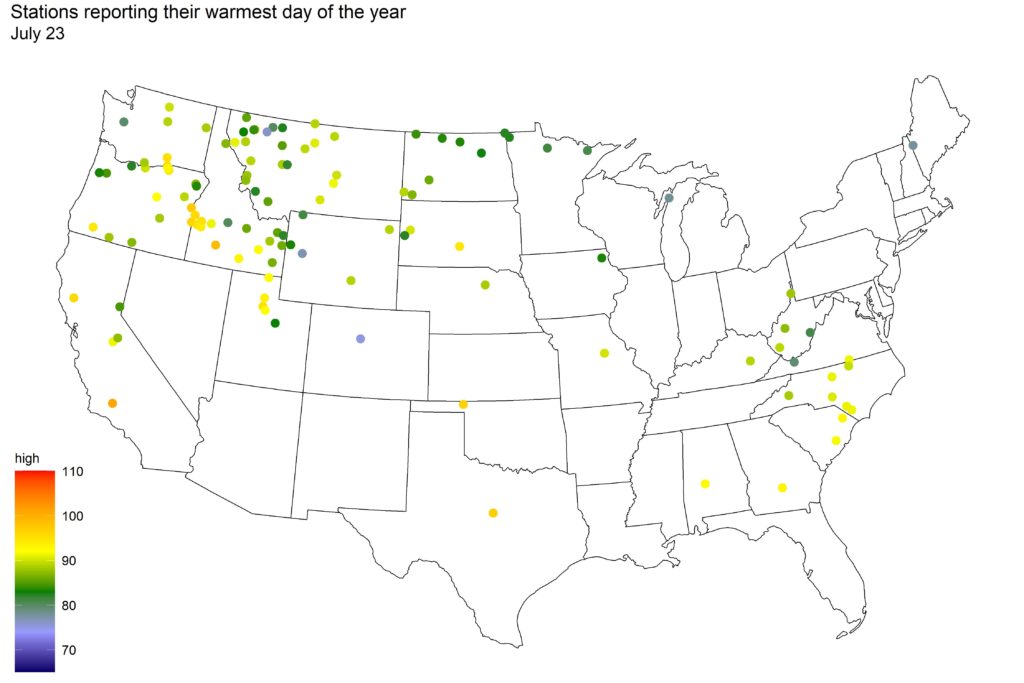
Just a few days later (July 23nd), only 118 stations report their yearly high:
But on July 28th, we’re back up to 456 weather stations with a yearly high:
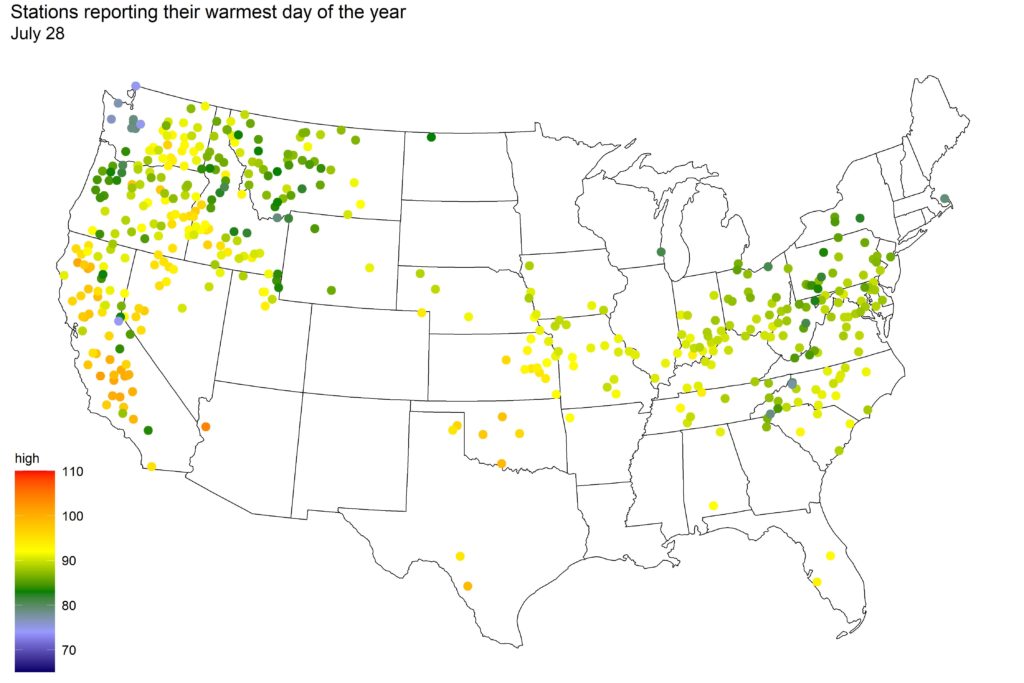
A steady climb up, then a quick drop down, then back up again – what’s up with that? One part of the answer you can see in those maps: the climate patterns in the various regions of America change over time. On July 18th, the northeast is going through its hot time of year. By the 28th, it’s the Northwest and parts of California that’s doing it. Different regions have different densities of stations (the northeast has more per area, for population and historical reasons), so as the “hot spot” of America moves, so does the number of locales reporting their hottest day of the year.
The second reason is that there appears to be a slight pulse in the temperature patterns. Here’s a chart of the average high temperature across all 5700 stations, over the course of a year:
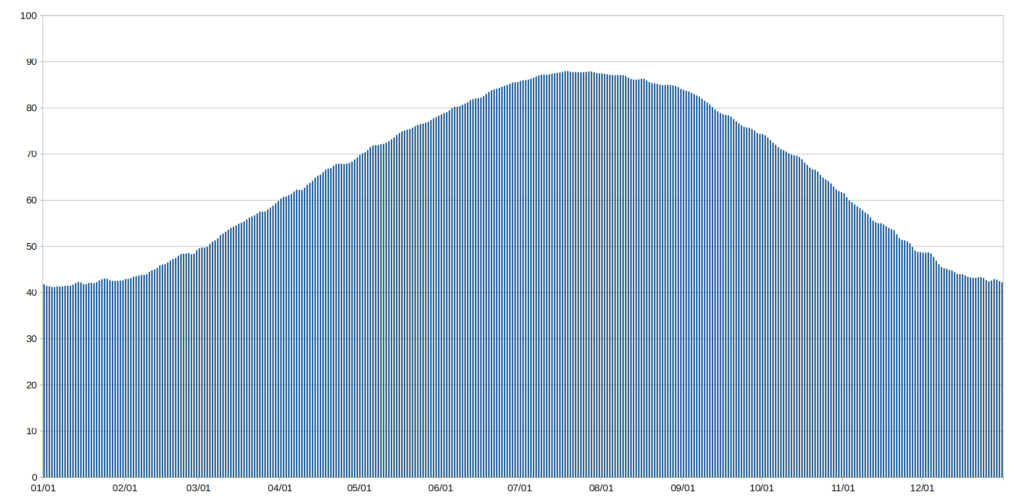
Looks pretty smooth, huh? But you might be able to see little bumps here and there (especially if you click on it to zoom in). Let’s zoom way in on a specific range, July 18 – 28:
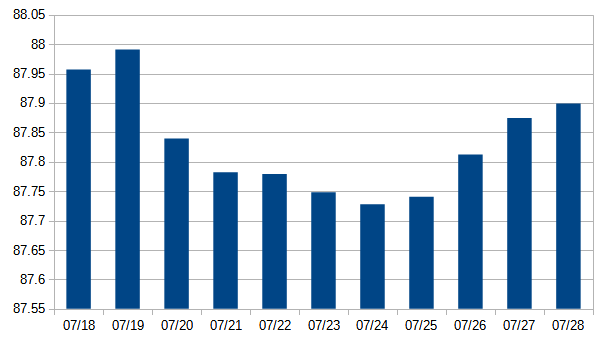
The average temperature, across the entire country, has little peaks and dips like this, all year long. They aren’t big, maybe a couple of tenths of a degree. But it’s enough to affect the frequency of yearly high temps.
What’s causing these fluctuations? I don’t know. Maybe there’s something wonky about the data I’ve collected (although with over 5000 stations, you’d think it would smooth out). Maybe there really are some weather patterns (jet stream?) that tend to occur on the same day each year. It’s puzzling, but it’s a puzzle that may remain unsolved.
