California and Florida had different approaches regarding public heath policies and COVID. California had strong rules enforcing shutdowns, mask and vaccine requirements, school closures, on so on. Florida had a more laissez-faire attitude (in fact, it prohibited localities from enacting strict measures). This resulted in fewer business closings and lower unemployment, but at what cost?
California’s death rate from COVID, expressed as deaths per 100,000 population since the start of the pandemic until now, is 216. Florida’s is 324. Take the difference between the two (108 per 100,000), multiply by Florida’s population (21.5 million), and you get: 23,200. That means that if Florida had the same death rate as California, it would have had 23,200 fewer deaths. At first blush, the cost of Florida’s lack of restrictions was 23,200 lives.
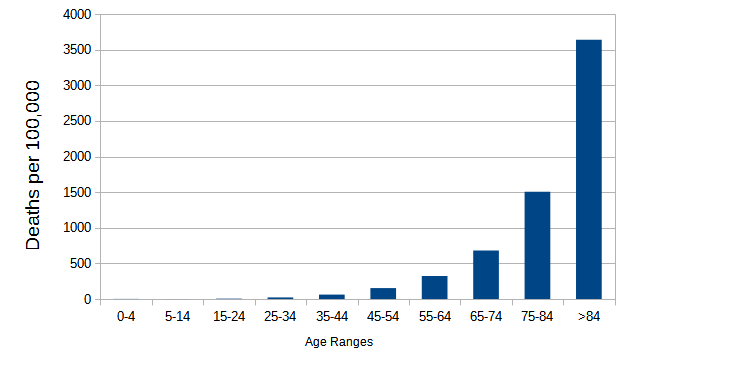
But, it’s been pointed out that Florida’s population is older than most states (all of those retirees, right?). And the COVID death rate skews massively toward the elderly:

So maybe the numbers are bad in Florida, not because of their policies, but because it has some many older folks. This theory certainly passes a sanity check: the death rate for those over 84 is ten times the 55-64 group and 60x the 35-44 group. Just a small number of extra people in those older age groups could certainly skew the numbers.
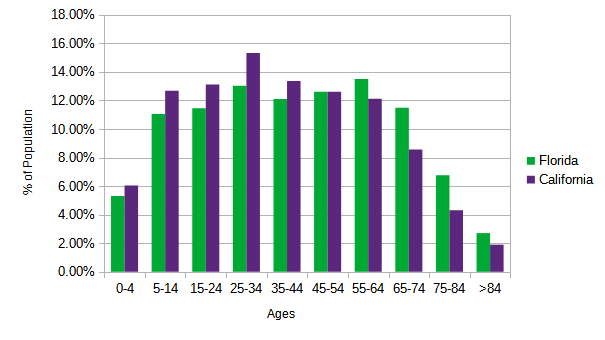
And, when it comes to population distribution by age, there are significant differences between California and Florida:

So the stereotype is true: there are lot more older folks in Florida. Could that explain the different death rates?
One way to figure this out is to take California’s death rates, by age, and apply them to Florida’s population distribution. That answers the question, “if Florida had the same age-adjusted death rate as California, how would its numbers look?”
| Age Range | Actual Deaths in Florida | If Florida had California’s death rates (by Age Group) |
| 0-4 | 25 | 9 |
| 5-14 | 23 | 9 |
| 15-24 | 212 | 133 |
| 25-34 | 851 | 579 |
| 35-44 | 2173 | 1481 |
| 45-54 | 4903 | 3881 |
| 55-64 | 10367 | 8960 |
| 65-74 | 15664 | 14486 |
| 75-84 | 18412 | 17729 |
| 85+ | 16870 | 16559 |
| Total | 69500 | 63825 |
In the timeframe studied, Florida had 69,500 actual COVID deaths. Using California’s age-based death rates, the total is 63,825. That’s a difference of 5,675. Considerably smaller than the number we got (23,200) when we used death rates that weren’t age-adjusted. At this point, we can say that, yes, Florida has had relatively more deaths than California, but, no, it’s not as bad as it seemed with the first calculation.1A big proviso in this analysis is that there is inconsistency between the deaths-by-age numbers for a given state, and the state-by-state total that is generally reported (the numbers come from two separate reports from the CDC). For example, Florida’s COVID death total is reported as 69,500 in the time frame studied. But the sum of each individual age range comes to a much lower number, 64,762. In other states, the sum of the age ranges is higher than the grand total. For the purposes of this study, I assumed that the state totals are correct, and adjusted the age-range numbers accordingly.
Of course, there’s no guarantee that this difference is solely due to California’s stricter actions. There may be other demographic or sociological differences between the states that affect the death rate. But as a first pass analysis, adjusting for age is the bare minimum you should do when comparing COVID death rates. Otherwise you end up with the 23,200 number, which is just not right. 5,675 may not be right either, but it is closer.
Even assuming no other adjustments are needed, an interesting question is: is it worth an extra 5,600 deaths to keep more businesses and schools open, and unemployment lower? I’m going to pass on that particular discussion; there are people who spend their careers doing analyses like that.
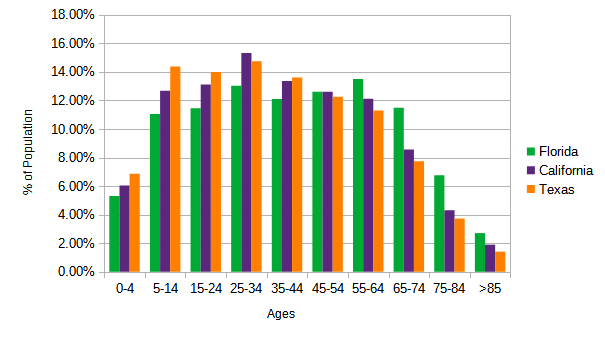
Oh, and while age adjustment helps Florida’s death total look better, it has the opposite effect for states that have a younger population. Take, for example, Texas. It’s population tends to be younger. Here’s the same graph that displays the population distribution by age, this time including the Lone Star state:

As you can see, Texas is full of young people. It already has a pretty high COVID death rate, and it looks even worse when you adjust for age. Texas stands at 83,231 COVID deaths. But if we apply the same adjustments as above and use California’s age-adjusted death rate, that number drops to 56,628. That’s an extra 26,600 deaths.
Of course you can’t just say “if Texas had done things like California, 26,600 of it citizens would be alive today”. There are a lot of other pieces to this puzzle. But nevertheless, it’s a pretty scary number.

My observation is that Texas people are more unhealthy as whole, probably have considerably more underlying conditions (diabetes, over weight, heart disease) than Florida people.
Jan: Nah! If a disease gets too close they just blast it with their handgun.
Other factors to consider would be population density and proximity to busy travel ports, especially busy international ports. My guess is that’s why NYC was hit so hard in the beginning.